

It’s a proud milestone for me (and for everyone at Carex) as we celebrate our 10-year anniversary.
Before diving into this month’s labor market data and analysis, I want to take a moment to thank you for welcoming my monthly updates into your inbox for the past 10-years. Whether you’re a partner, candidate, consultant, or friend of Carex, your support and engagement have helped shape our journey over the past decade.
If you’re reading this, you’re part of our story, and I’m genuinely grateful for that. To celebrate this milestone, we put together a short video reflecting on the past 10 years. If you’d like to take a look, you can watch it here: Carex 10-Year Video.
Now, here’s our labor market insights for August 2026, written by Matt Duffy:
This month’s headline that the U.S. lost 23,000 jobs is certainly attention-grabbing. And it may prove significant, but not necessarily yet.
We know labor market data moves in cycles, and one month’s headline isn’t enough to establish a trend. YTD job growth has been largely healthy, so rather than overreact to a single data point without a clear trend line, I’d like to focus on two other headlines making the rounds that I believe could be misleading.
Labor Market Insights (and the stories the headlines miss)
Every month, there seems to be a new narrative explaining the labor market. Two of them, in particular, drive me absolutely nuts. I’m not entirely sure why they bother me so much, maybe because they’re presented as “edgy” takes and inevitably become clickbait for lazy, headline-driven stories.
The two narratives?
- “Americans just don’t want to work anymore.”
- “AI is wiping out white-collar jobs.”
The problem is that many of these conclusions rely on surface-level data without looking at what’s actually driving the numbers. I recently came across two charts that provide a great reminder that demographics and industry composition matter, and that simple explanations often miss the bigger picture.
The first chart (created by Nicolas Petrosky-Nadeau, Vice President, Macroeconomic Research at Federal Reserve Bank of San Francisco) addresses the headline that Americans are dropping out of the labor force because they don’t want to work.
Lazy Headline #1:
- Data Point = “The Labor Force Participate rate is dropping!”
- Conclusion = “Younger generation(s) are lazy and don’t wan’t to work!”
- The Reality = Americans haven’t stopped working – they’re getting older
One of the most common claims is that Americans have become less willing to work because labor force participation has fallen from roughly 67% in the early 2000s to just over 62% today. At first glance, that seems convincing. But the first chart tells a much different story. If you adjust today’s labor force participation rate to reflect the same age distribution the U.S. had in 2000, participation would still be hovering around 67%, essentially unchanged over the past quarter century.
The implication is significant. The decline in participation isn’t primarily because working-age Americans have become less engaged with the workforce. It’s because the country’s population has aged. As Baby Boomers have moved into retirement years, they naturally participate in the labor force at lower rates (and we’re not having enough babies to replace them).
That distinction matters. An aging workforce creates structural labor shortages that employers continue to experience today. Even if demand for workers moderates during periods of slower economic growth, the supply of available labor is permanently smaller than it would have been twenty years ago. In other words, today’s hiring challenges are driven far more by demographics than by a lack of work ethic.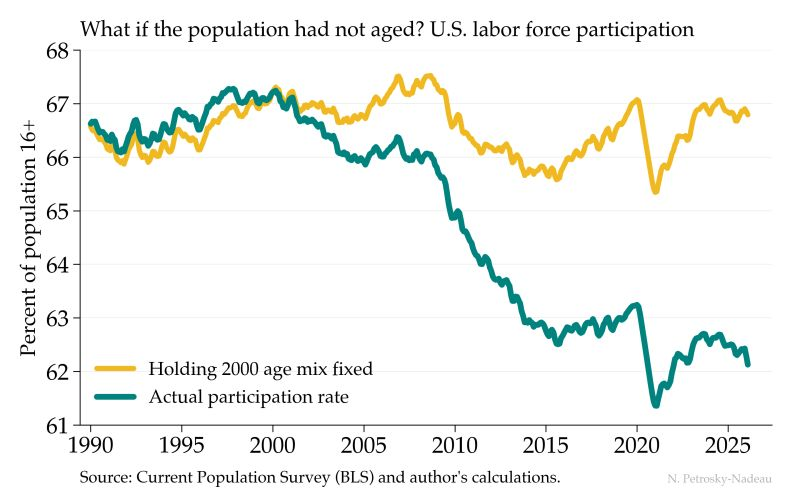
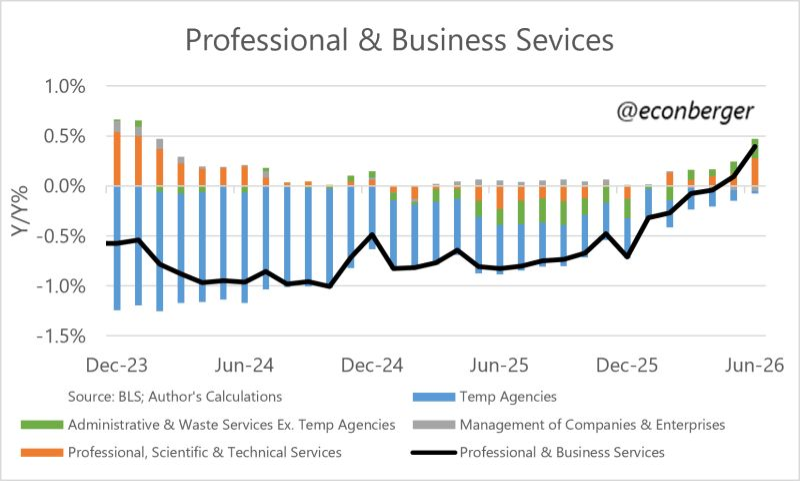
The second chart (created by Guy Berger, Senior Fellow at the Burning Glass Institute) addresses the headline that AI is wiping out white collar jobs.
Lazy Headline #2
- Data Point = “Employment in white collar sectors is deteriating!”
- Conclusion = “AI is killing employment!”
- The Reality = Over the past two years, much of the white collar weakness wasn’t driven by software engineers, consultants, or accountants losing jobs to artificial intelligence – it was driven by temporary staffing firms.
Not every “white collar” story is about AI. AI has quickly become the default explanation for almost every trend in professional employment. But the second chart shows why we should be cautious. Professional & Business Services is often described as a proxy for white-collar employment. In reality, it’s an incredibly broad category that includes:
- Professional, Scientific & Technical Services
- Corporate headquarters and management companies
- Administrative support services
- And yes….temp staffing agencies
Temporary help services were among the hardest-hit industries as employers slowed hiring and became more cautious about adding headcount. As hiring activity has gradually improved in 2026, those same temp agencies have led much of the sector’s recovery. Professional, Scientific & Technical Services – the category most people associate with AI exposure, has also improved, but far more gradually. The takeaway? Not every slowdown in office-based employment is evidence that AI is replacing workers. Sometimes it’s simply a reflection of hiring cycles, business confidence, and employers using temporary labor as a leading indicator of economic activity.
The labor market remains one of gradual normalization, not dramatic disruption. And as always, the most interesting stories are often found beneath the headline numbers.
By the Numbers:
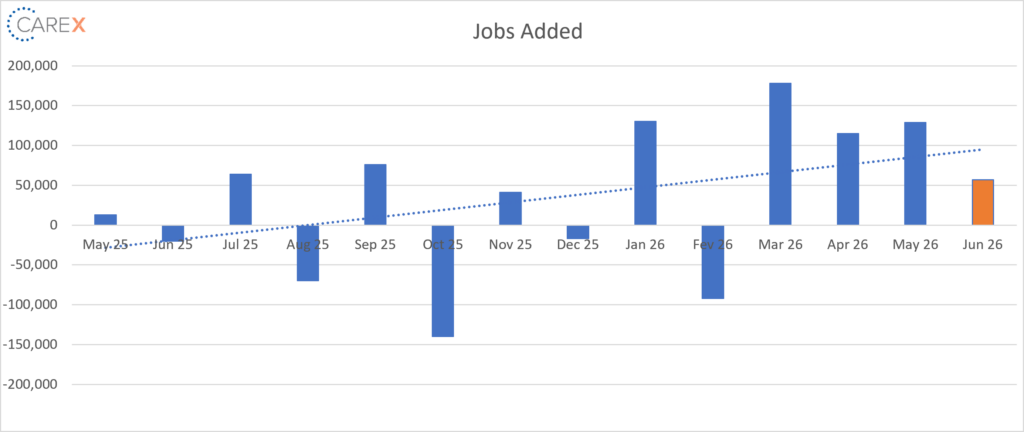
- New Jobs – The U.S. lost 23,000 jobs in July
- The previous 4-months averaged ~95,000 jobs gained
- Job gains are largely coming from just one sector: healthcare and social assistance (+ 22,600 jobs last month).
- Job losses were heavy in local government (- 57,000 jobs) and leisure and hospitality (-40,000 jobs)
- Unemployment dropped to 4.1%, down from 4.2% the previous month
- The unemployment rate continues to fall largely because people are leaving the labor force (see above for context)
- Job openings dropped to 7.3 million, down from 7.5 million the previous month
- Health care and social assistance accounted for the steepest drop, losing 147,000 vacancies, while leisure and hospitality shed 86,000 and wholesale trade fell by 74,000. Professional and business services fell by 71,000.
- Partially offsetting those declines, transportation, warehousing, and utilities added 97,000 openings, and federal government postings climbed 39,000.
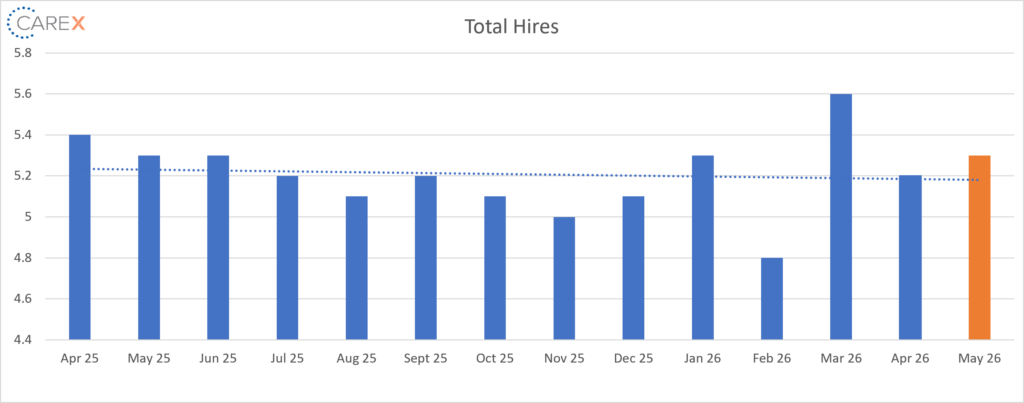
- Hires increased slightly to 5.3 million, up from 5.2 million the previous month
- Health care and construction posting the largest gains
- Layoffs increased slightly to 1.8 million, up from 1.7 million the previous month
-
- The layoff rate increased to 2%
- Quits increased slightly to 3.2 million, up from 3.1 million
- Quits, which are seen as a measure of worker confidence in the ability to change jobs and find another one continues to remain very low
- Total separations increased to 5.4 million, up from 5.1 million the previous month
- Total separations were little changed in all industries
- Jobs per available worker sits at 1:1
- Up from 0.95 three months ago

To make sure you never miss a Labor Market Insights update, you can subscribe to receive reminders via email! While you’re here, make sure to check out the other resources we have available.