
Introducing…the Carex Labor Market Index! Each month, we’re bringing you a quantifiable “score”—calculated using 8 data sets and a weighted scoring system—that provides a quick snapshot of the health of the market.
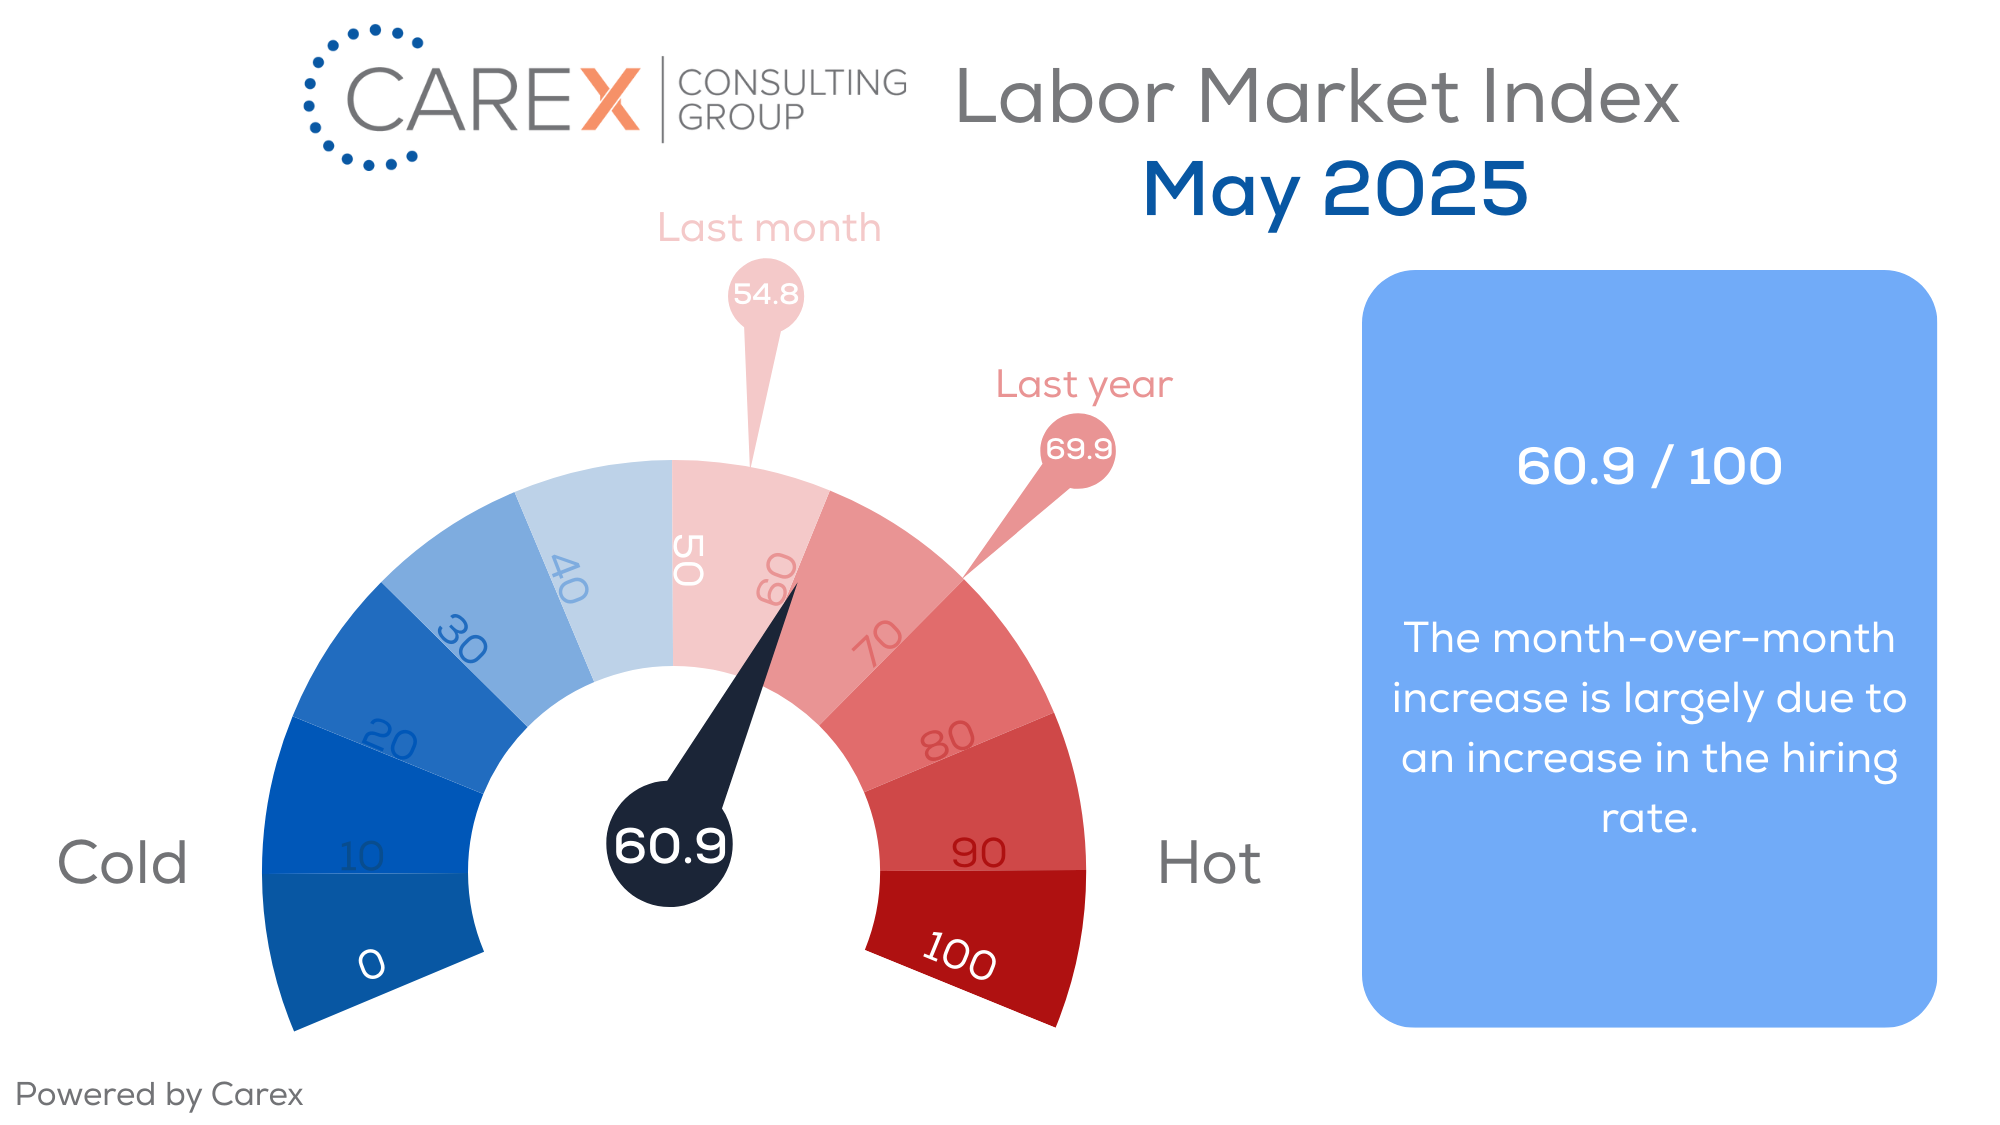
Now, here’s our labor market insights for May 2025 written by Matt Duffy:
Key Takeaways:
Millions of young people will be graduating college this month. Proud parents will be watching their child walk across the stage preparing to explore the next chapter of their lives. So, how does the labor market look for recent college graduates? It’s like how it felt watching the Bucks exit the NBA playoffs last week—disappointing and concerning.
Before we explore the job market for college grads, I’ll make just a few points about the broader labor market. First, the BLS data offers a glimpse of labor market conditions, but only from the rearview mirror. The last couple of months suggest the road has smoothed—layoffs remain low, the hiring rate has stalled, and quits & layoffs remain largely unchanged. However, shifting the lens from the rearview mirror to the windshield suggests the road might be getting a bit bumpy.
Growing geopolitical concerns (trade policy and tariffs) suggest a very real possibility that some businesses might slam on the hiring brakes. The sharp declines in job openings (and consumer confidence) are telltale signs of how bad tariffs are being viewed by the market—my suspicion is that we’ll see unemployment rise and job openings continue to decline through the summer months.
Since most tariffs didn’t take effect until early April, their full impact on the labor market likely won’t be reflected for another couple of months. However, I think it’s very likely we’ll see a meaningful slowdown in hiring in the coming months as business plans are put on hold amid rising uncertainty. If the situation persists, businesses in select sectors (Manufacturing, etc.) may move beyond pausing hiring and begin considering layoffs as demand continues to soften.
Job Market for Recent College Graduates:
The most severe labor shortages today are in positions that don’t require a college degree. Over the past year, advancements in AI have significantly increased efficiency in many white-collar professions—such as marketing, finance, and IT—reducing the need for human labor in fields that traditionally hired recent college graduates. This, combined with global geopolitical instability and the swift rollout of AI technologies, is contributing to an increasingly uncertain job market for new graduates.
- Unfortunately, the labor market for recent college graduates has deteriorated noticeably in the first quarter of 2025.
- The unemployment rate for recent graduates jumped to 5.8%.
- The underemployment rate for that same group rose sharply to 41.2%.
- Meanwhile, grad- and law-school applications are increasing—an ominous echo of when young people used graduate school to bunker down during the Great Recession.
- Recent college unemployment has climbed to the highest level since August 2021 and a nearly 130 basis-point increase over two years.
- Workers of the same age without college degrees had an unemployment rate of 6.7% in September, which was relatively unchanged from where it was two years ago and marks the second smallest spread in joblessness between these two groups of workers in decades.
- The number of Americans with a bachelor’s degree or higher grew to 85 million in 2021 from 47.2 million in 2001 (an 80% increase).
- As the price tag for the average tuition at a private four-year college more than doubled over that time.
- Recently, sectors with less educational barriers to entry—like healthcare support, trades and logistics—are still seeing strong labor demand and wage growth, while fields with relatively high educational requirements, such as technology and finance, are seeing labor supply tipping above demand.
- AI is having a notable impact on college graduate hiring—many of the roles companies historically hire new graduates for are the first ones being impacted by AI.
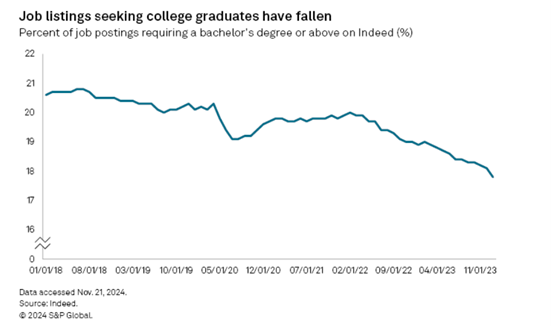
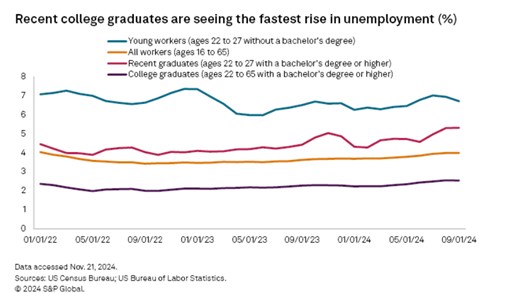
The following graphs highlight two notable trends: (1) employers are less apt to require a college degree when hiring, and (2) college graduates are still more likely to be employed vs. non-graduates; however, recent college graduates are finding it difficult to find a job.
By the numbers:
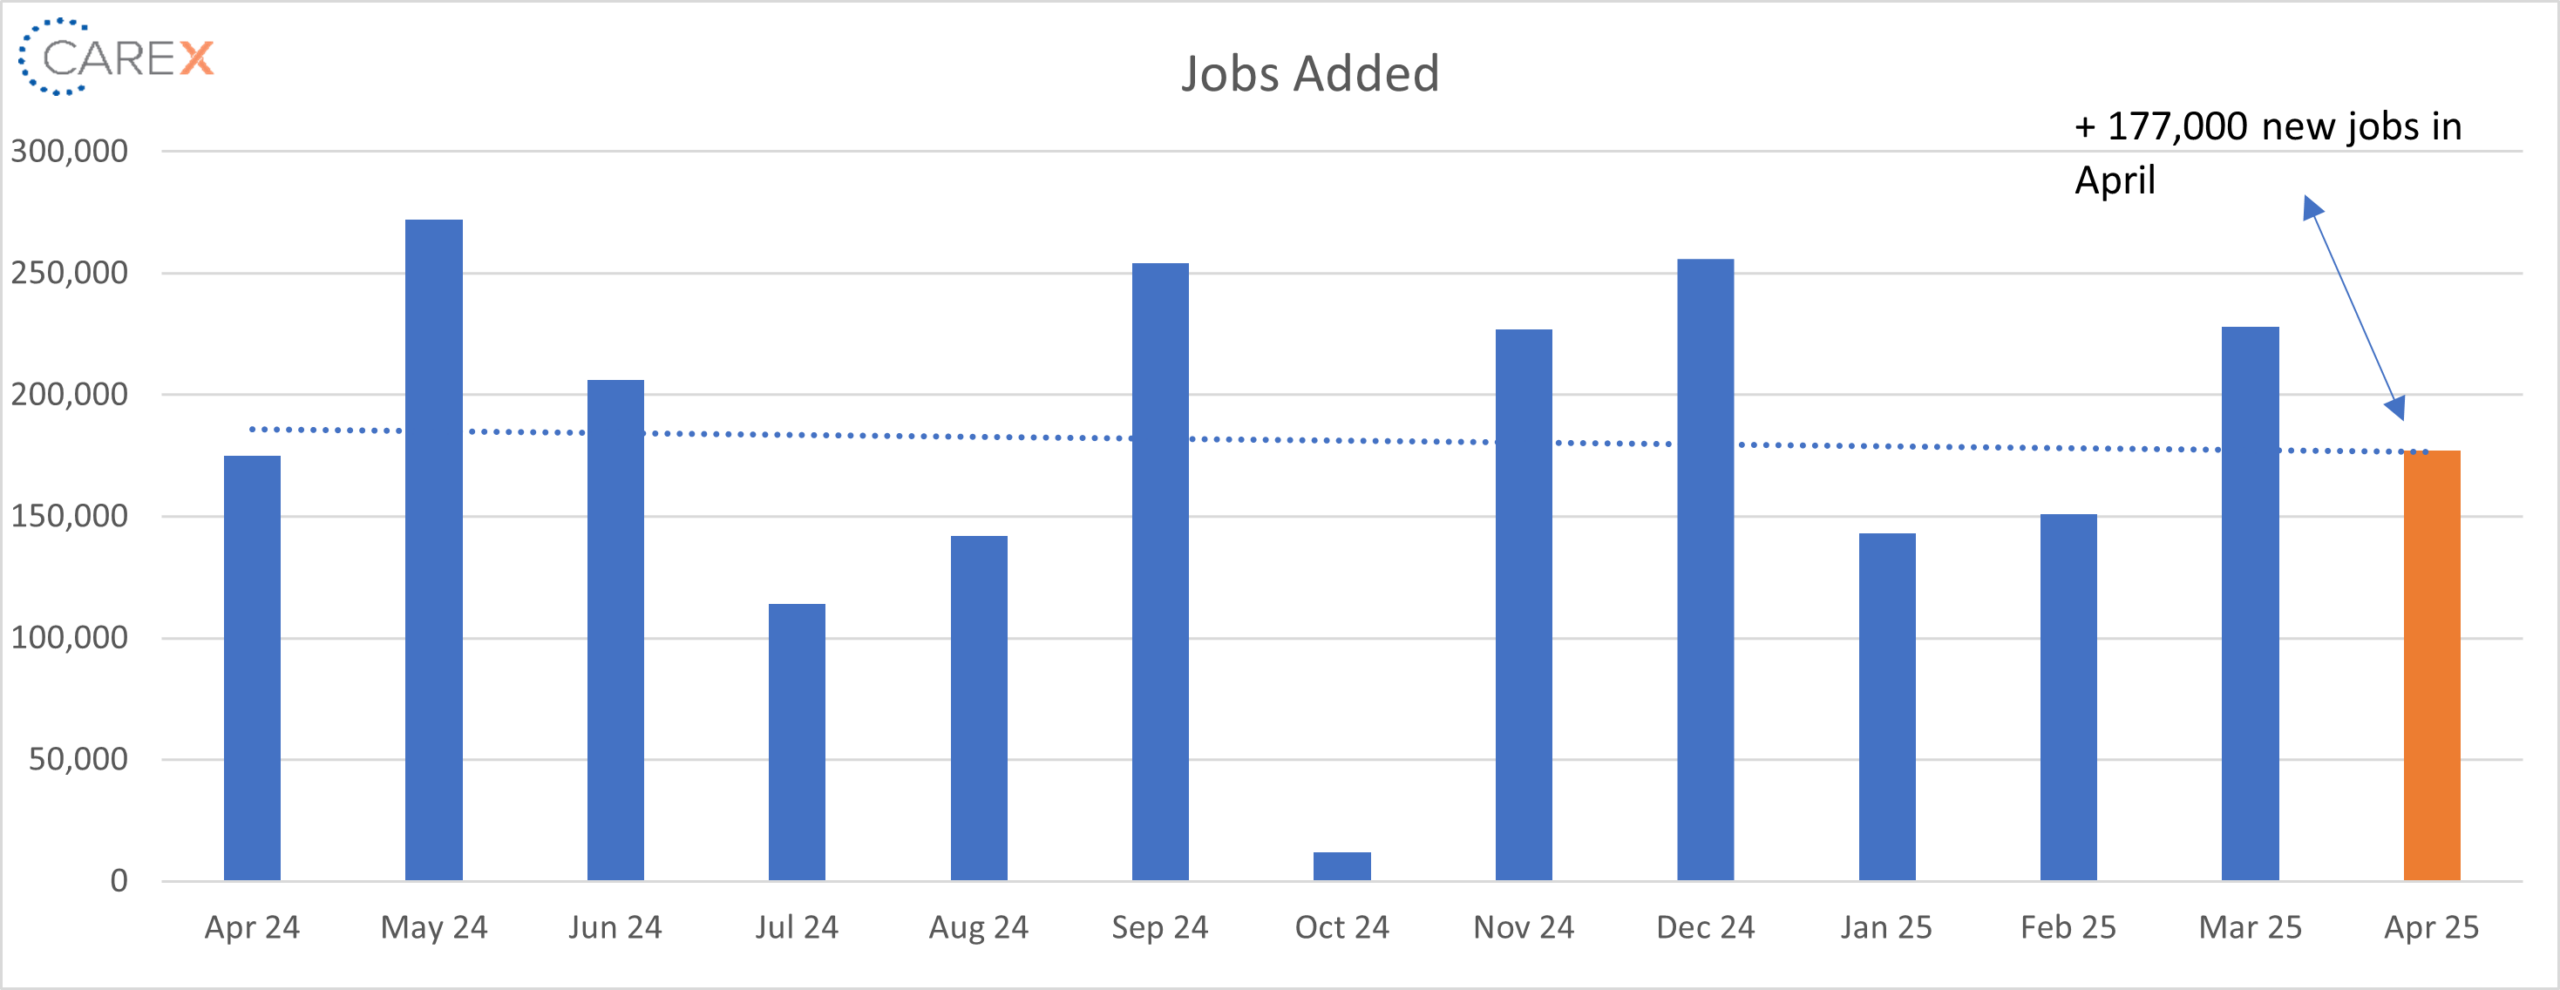
- New Jobs – the U.S. added 177,000 new jobs in April.
- Transportation and warehousing employers added 29,000 roles. These gains are at least partially due to the tariff frontloading.
- Professional and Business Services netted 17K jobs—well above its average loss of -3K jobs since last April.
- Unemployment remained unchanged at 4.2%.
- The first time since 2021 that unemployment has been at or above 4% for eleven consecutive months.
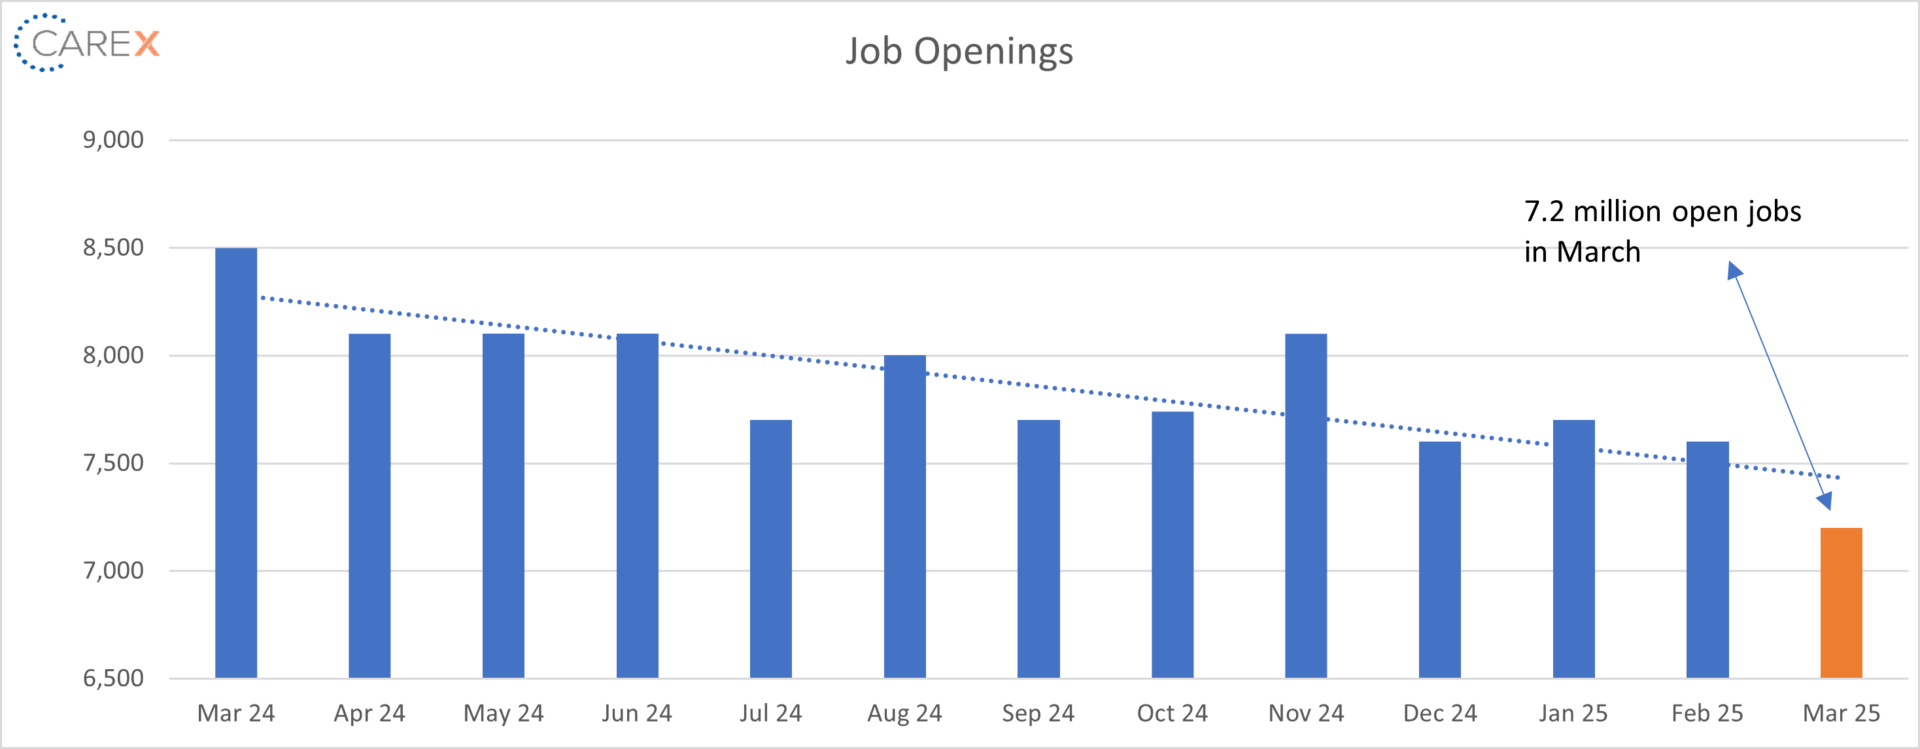
- Job openings dropped to 7.2 million, down from 7.6 million the previous month.
- Down by ~900k over the year.
- Not surprisingly, the number of job openings decreased in the federal government (-36,000).
- The 7th consecutive month job openings were below 8 million.
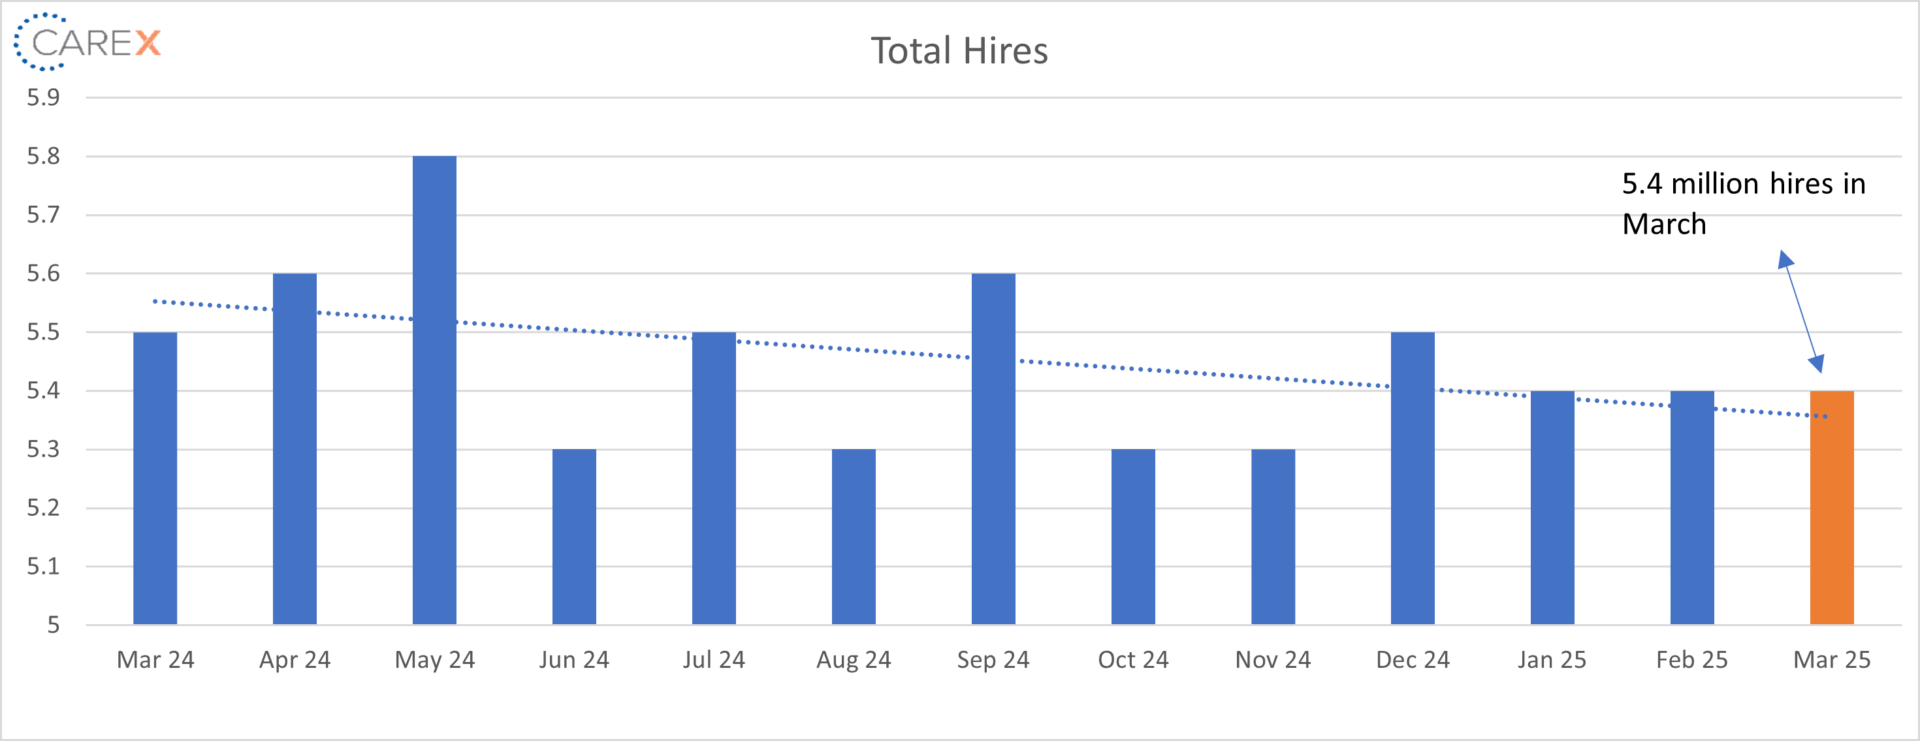
- Hires were unchanged, standing at 5.4 million.
- Down from 5.5 million this time last year.
- Layoffs dropped to 1.6 million, down from 1.8 million the previous month.
- Cuts within the federal government still haven’t fully been captured in the JOLTS reports.
- Quits increased slightly to 3.3 million, up from 3.2 million the previous month.
- Quits, which are seen as a measure of worker confidence in the ability to change jobs and find another one continues to remain very steady (and very low).
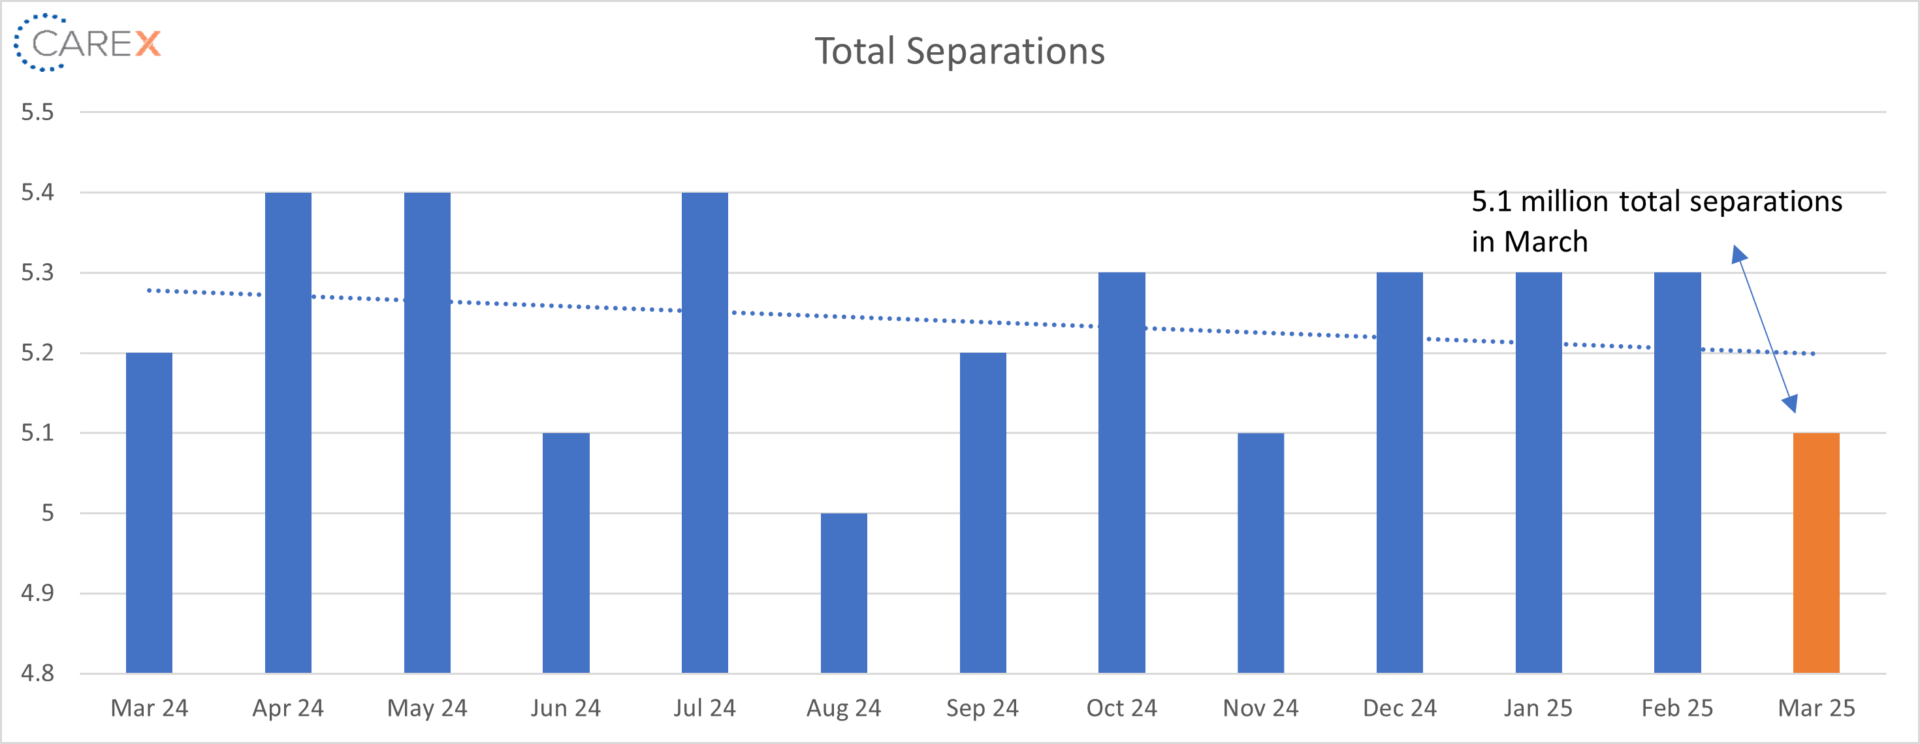
- Total separations fell to 5.1 million, down from 5.3 million the previous month.
- Total separations have remained steady for the past 12 months.
- Jobs per available worker fell for the first time in six months, dropping to 1:1, down from 1.1:1.
- At its peak in 2022, the ratio was 2:1.
- Labor Force Participation Rate (LFPR) held steady at 62.5%.
- It hit a high of 67.3% in early 2000 and fell to 63.3% in the month before the onset of the pandemic.
To make sure you never miss a Labor Market Insights update, you can subscribe to receive reminders via email! While you’re here, make sure to check out the other resources we have available.