
New job reports were just released! Here’s our labor market insights for April 2024.
Key Takeaways:
You can’t rewrite history. If that was possible, I would have seriously reconsidered my mullet phase. And my first tattoo. In fact, an entire year in my early 20s would have been wiped from history.
Me: “You can’t rewrite history.”
The Government: “Hold my beer.”
One of my incredibly smart colleagues (that’s you, Drew Schroeder) recently pointed out that my reporting of monthly job gains (an important factor measuring the health of the labor market) is incorrect. His contention is that total job adds are significantly lower than first reported. And he’s right. The BLS does rewrite history—in fact, they do it every month. In 2023, job gains were downwardly revised in 10 of the 12 months. For the year (2023), revisions essentially wiped out ~400,000 jobs. In August 2023, the BLS issued a preliminary revision for the 12 months through March 2023 showing that ~25,000 fewer jobs were added on average per month in that period. Yes, (job) history can be rewritten, and it’s almost always less rosy than the first version.
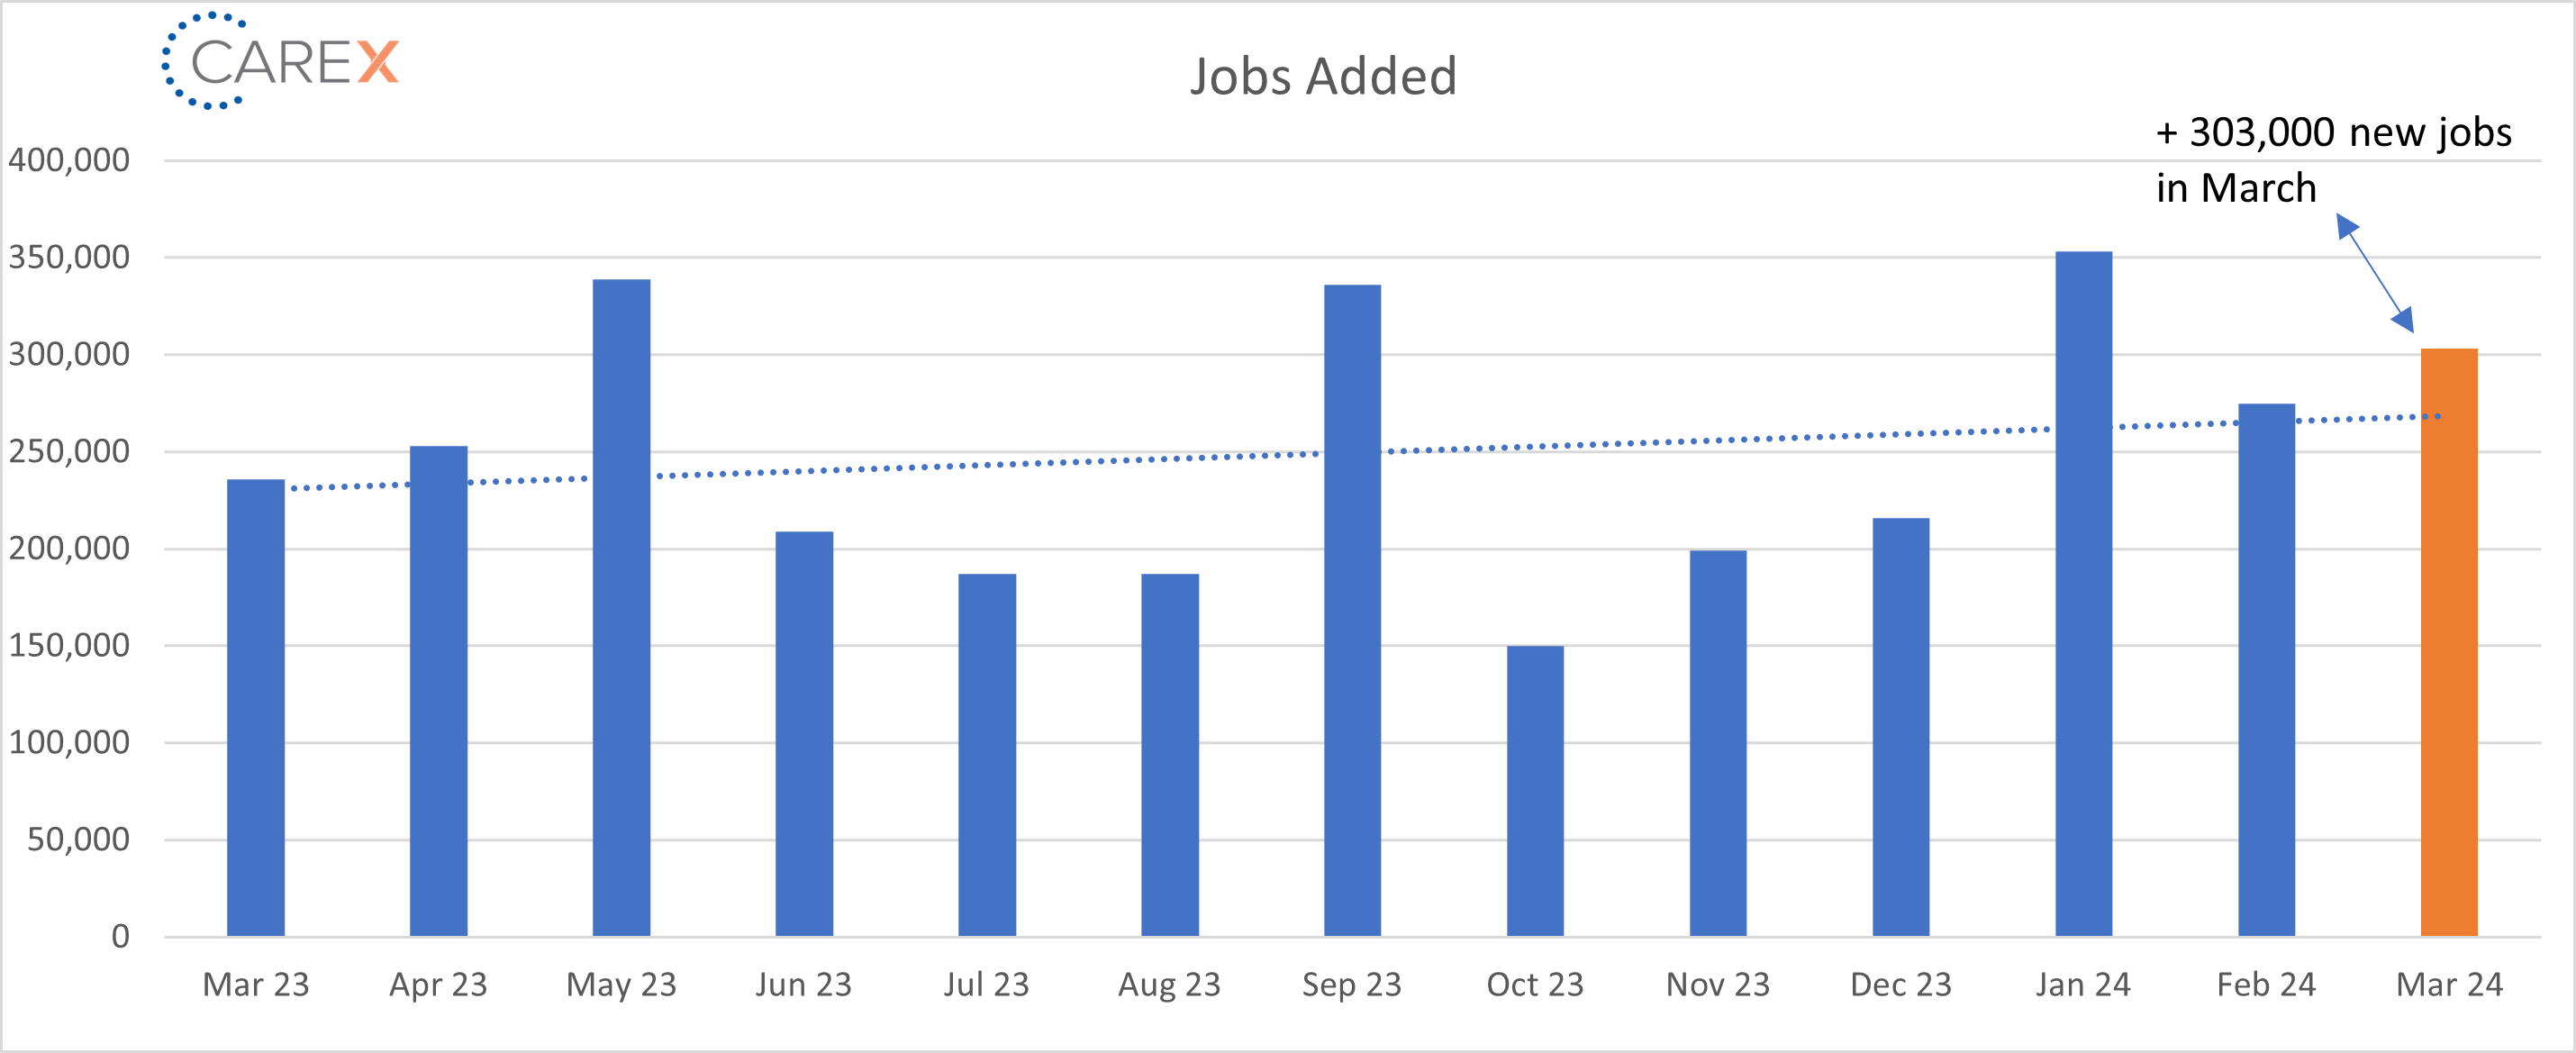
If you’ve read my last two monthly reports, you would’ve noticed a strong tone of general labor market optimism, not in small part due to monthly job gains. So, given these revisions, is there still cause for optimism? Yes (albeit a bit more tempered), even after the revisions— (1) we’re still adding ~300k new jobs per month; (2) unemployment remains historically low; and (3) layoffs have stabilized. As with any fluid market, things are never simply “good” or “bad,” but data suggests stabilization with generally positive tailwinds.
No additional commentary this month, I’ll simply defer to this month’s (yet to be revised) numbers.
By the Numbers:
- New Jobs – The U.S. added 303,000 new jobs last month, far outpacing all expectations.
- Healthcare, construction, and government showed the largest areas of growth.
- Unemployment fell to 3.8%, down from 3.9% the previous month.
- The Fed anticipates (hopes) it’ll hit 4.1% by the end of the year.
- It’s been under 4% for 26 months (a record not seen since the 1960s).
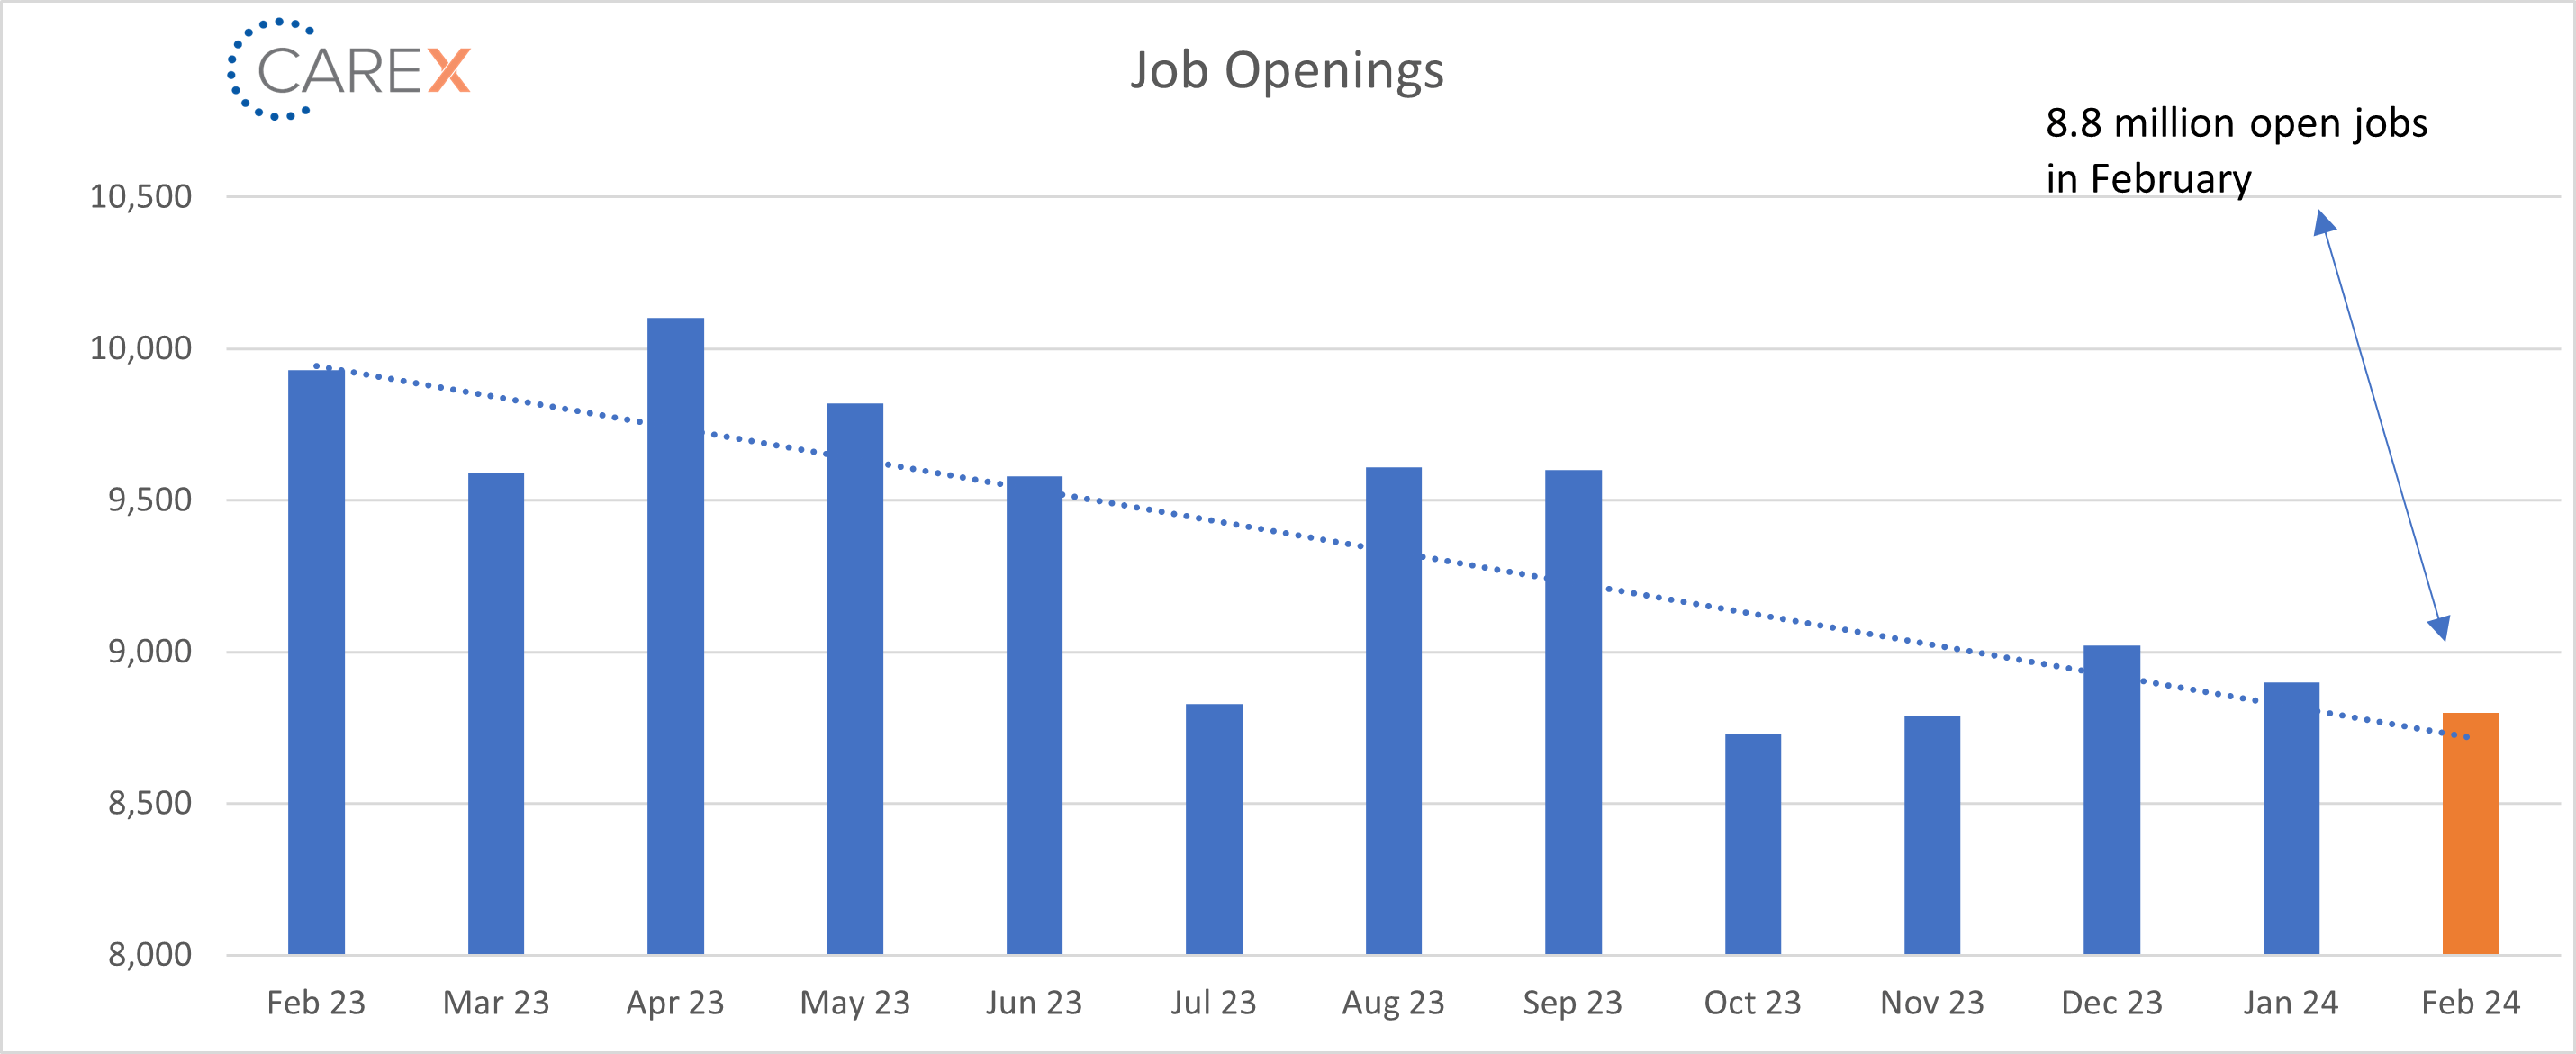
- Job openings dropped slightly to 8.8 million, down from 8.9 million the previous month.
- Job openings peaked at a record 12.0 million in March 2022.
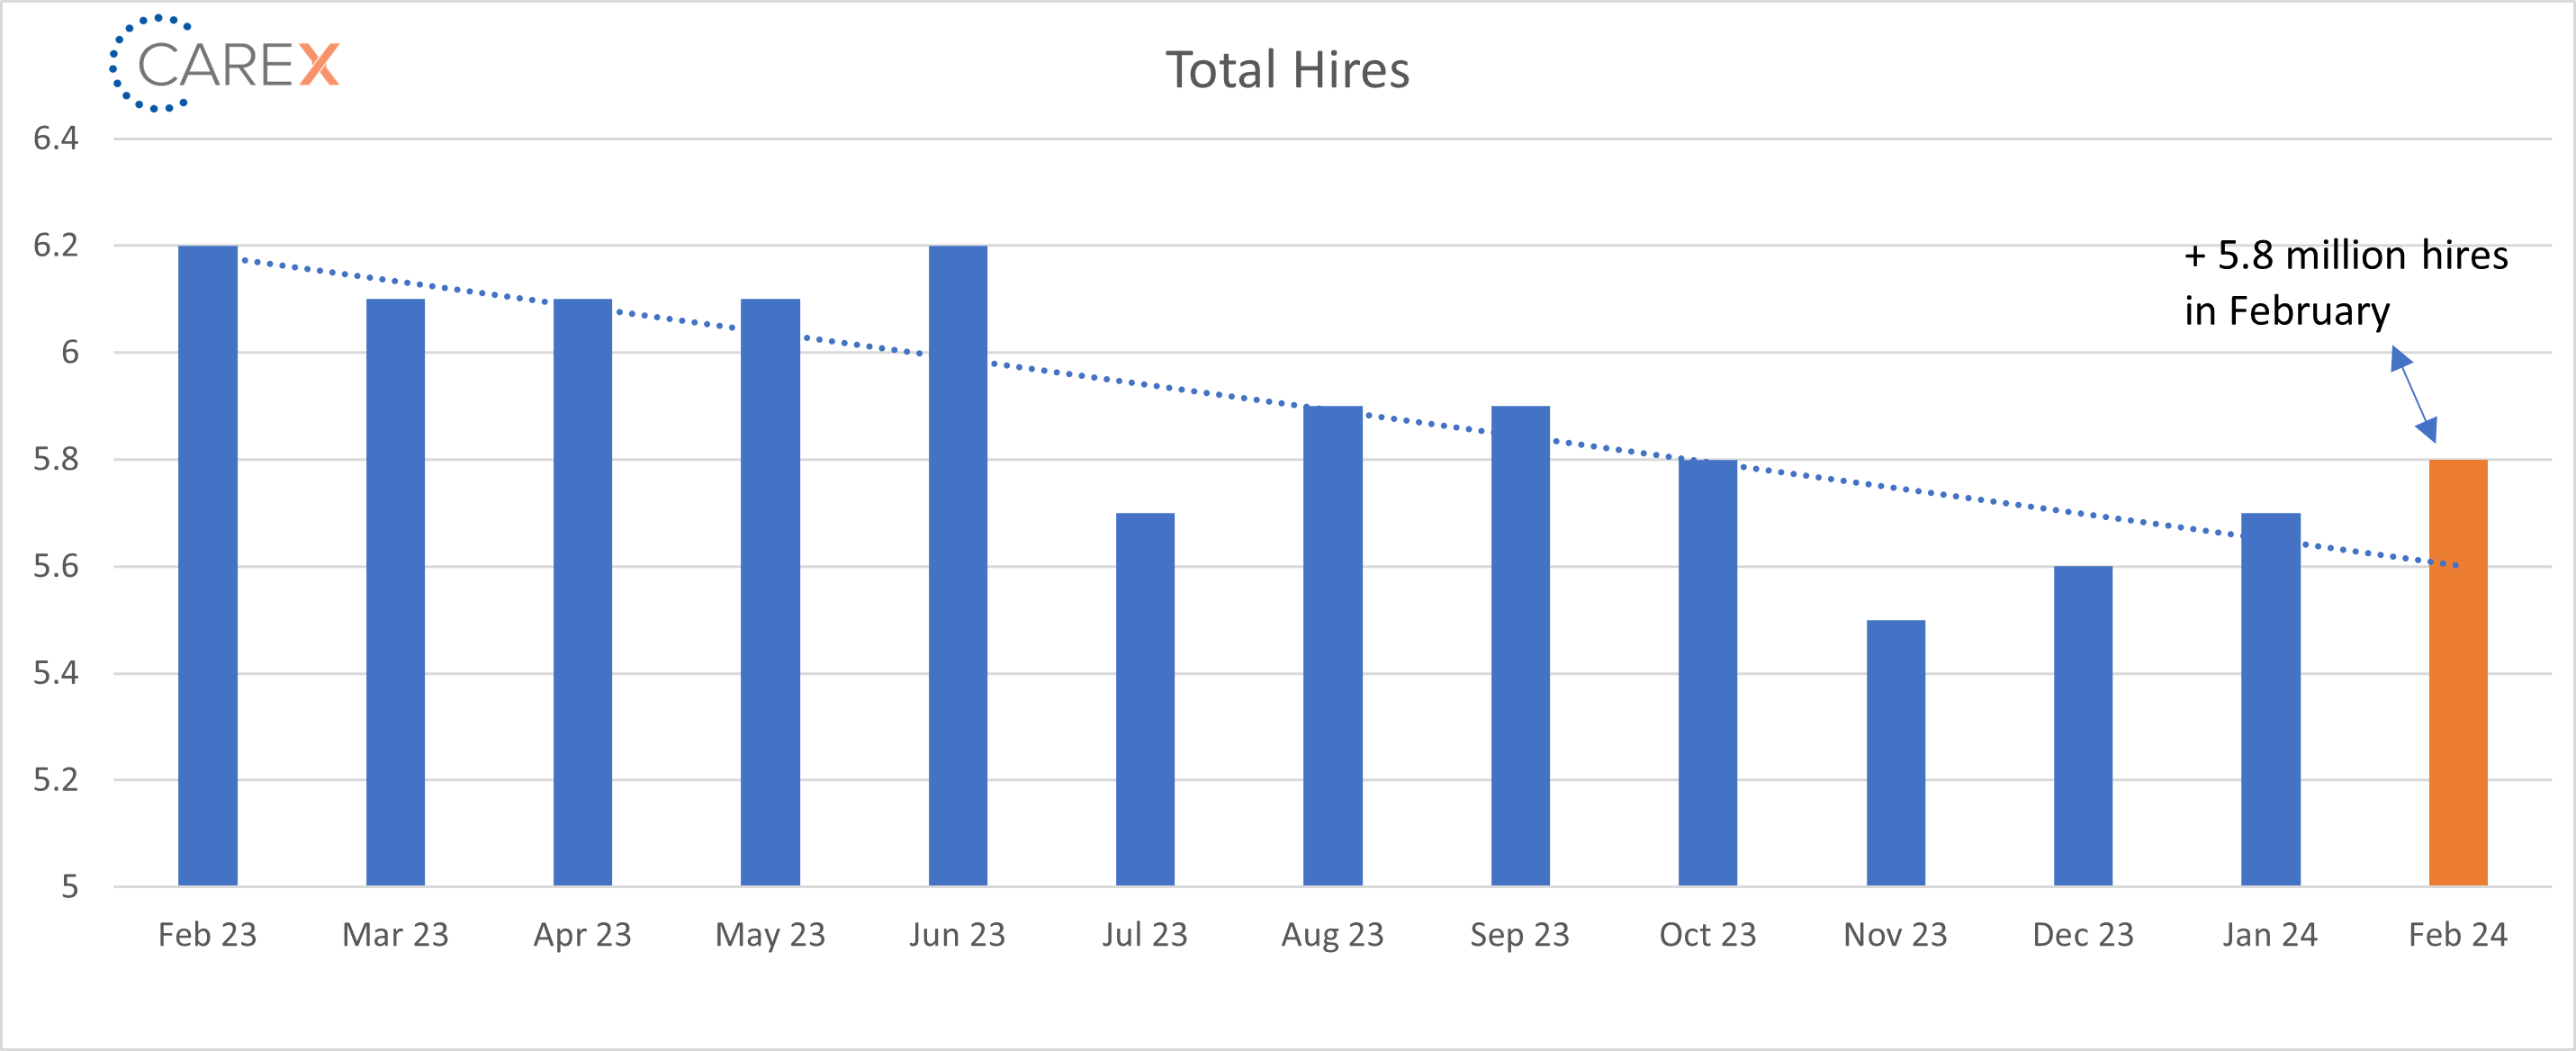
- Hires increased slightly to 5.8 million, a slight increase from 5.7 million the previous month.
- We’ve seen three straight months of hiring growth.
- Layoffs increased slightly to 1.7 million, up from 1.6 million the previous month.
- The layoff rate stayed at ~1% for the 6th consecutive month.
- The number of layoffs remains very low by historical standards.
- Quits increased slightly to 3.5 million, up from 3.4 million the previous month.
- Quits, which are seen as a measure of worker confidence in the ability to change jobs and find another one, continue to remain very steady (and very low).
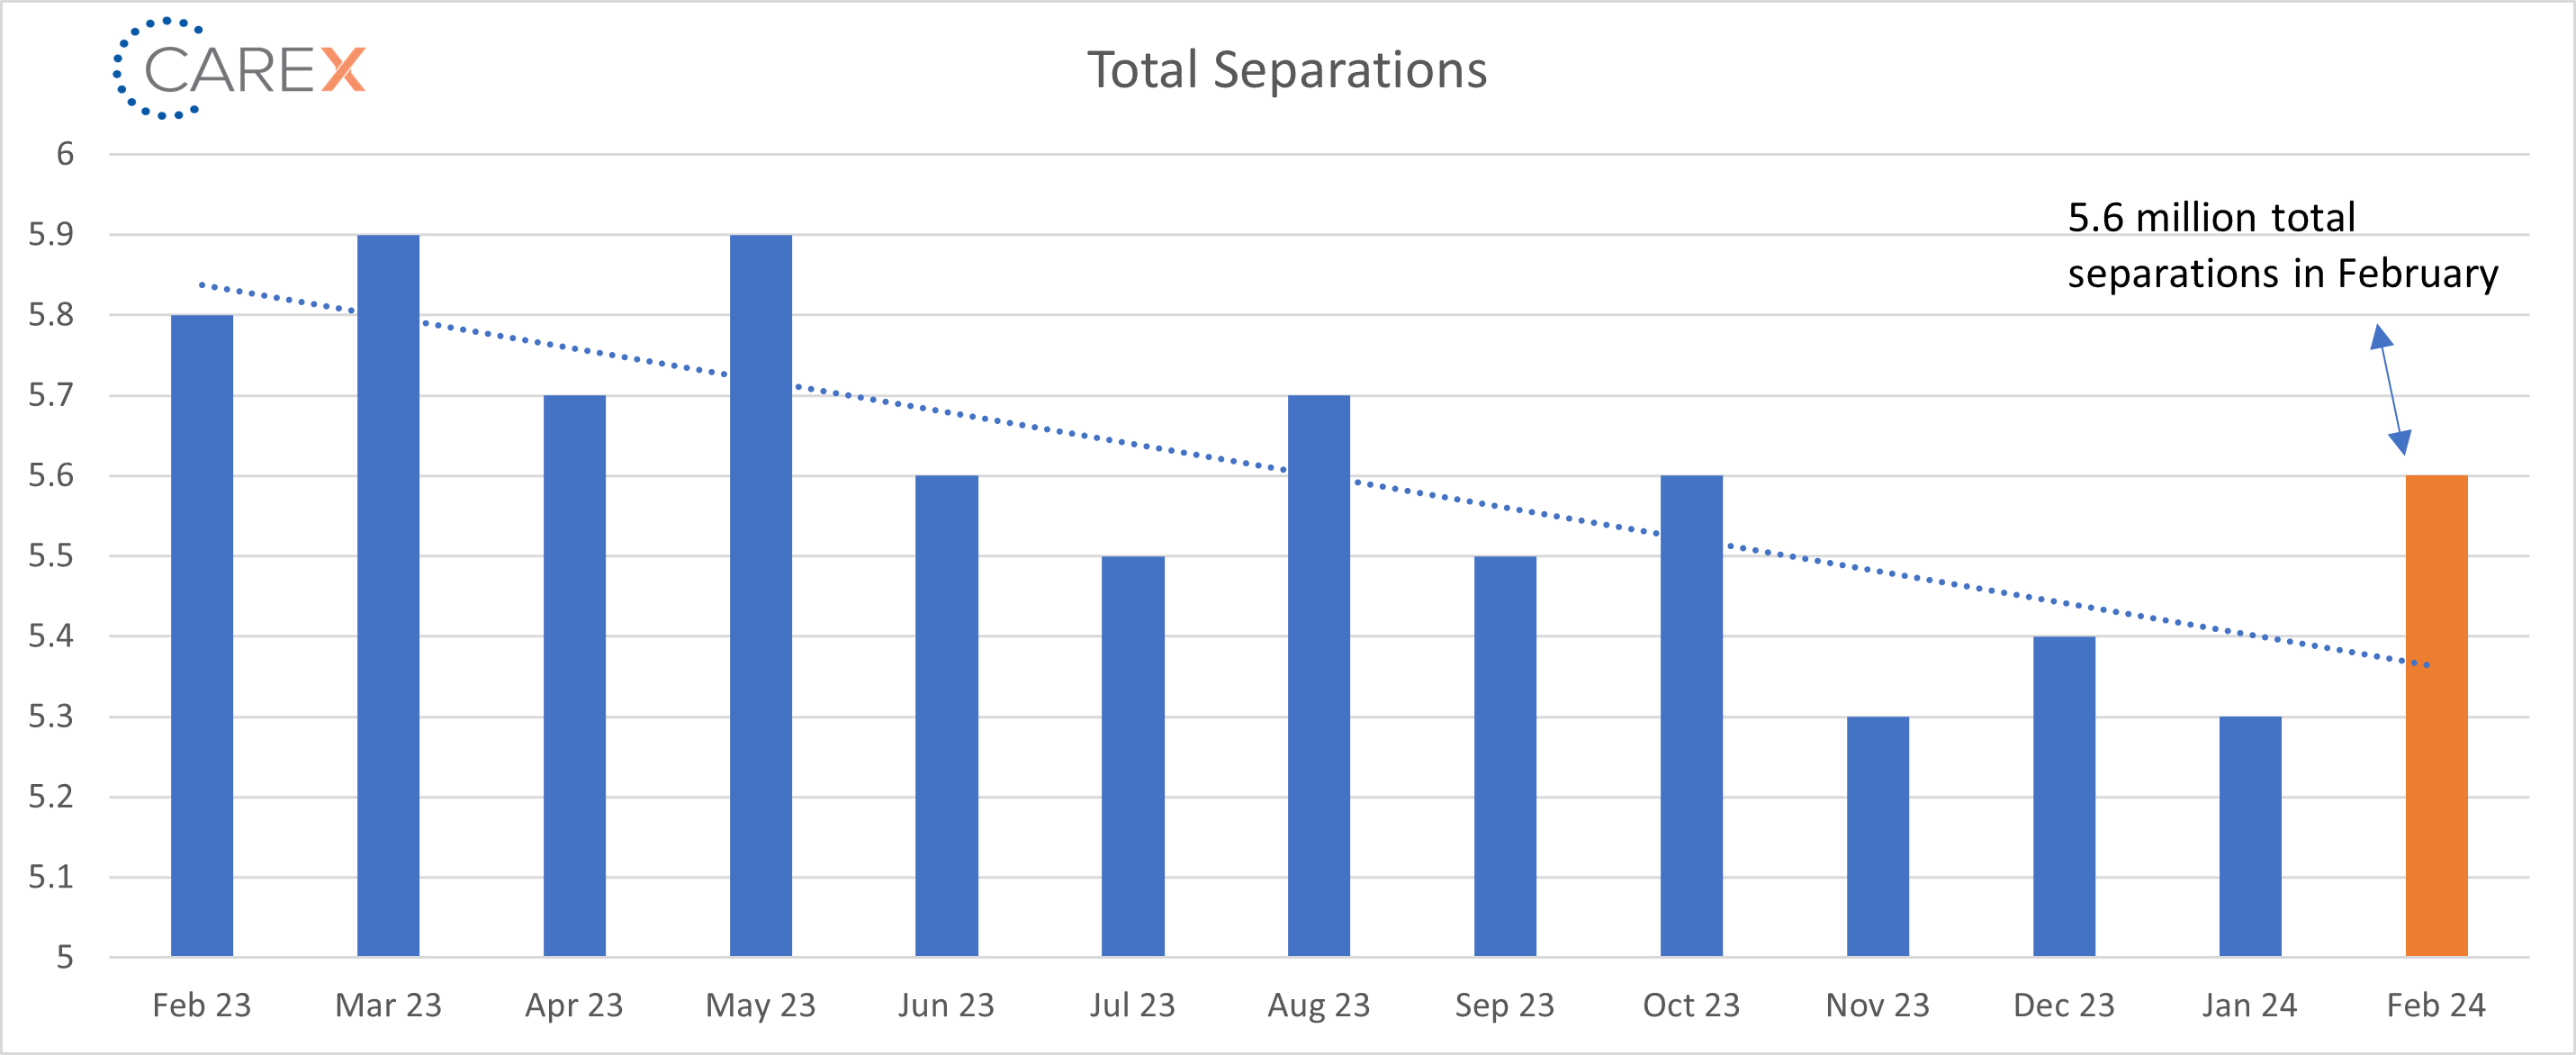
- Total separations increased to 5.6 million, up from 5.3 million the previous month.
- While a notable increase from the previous month, this is generally in line with previous averages.
- Jobs per available worker dropped to 1.3:1, down from 1.4:1 the previous month.
- Noticeably down from 1.8:1 last summer.
- This ratio averaged ~2:1 over the past 2 years.
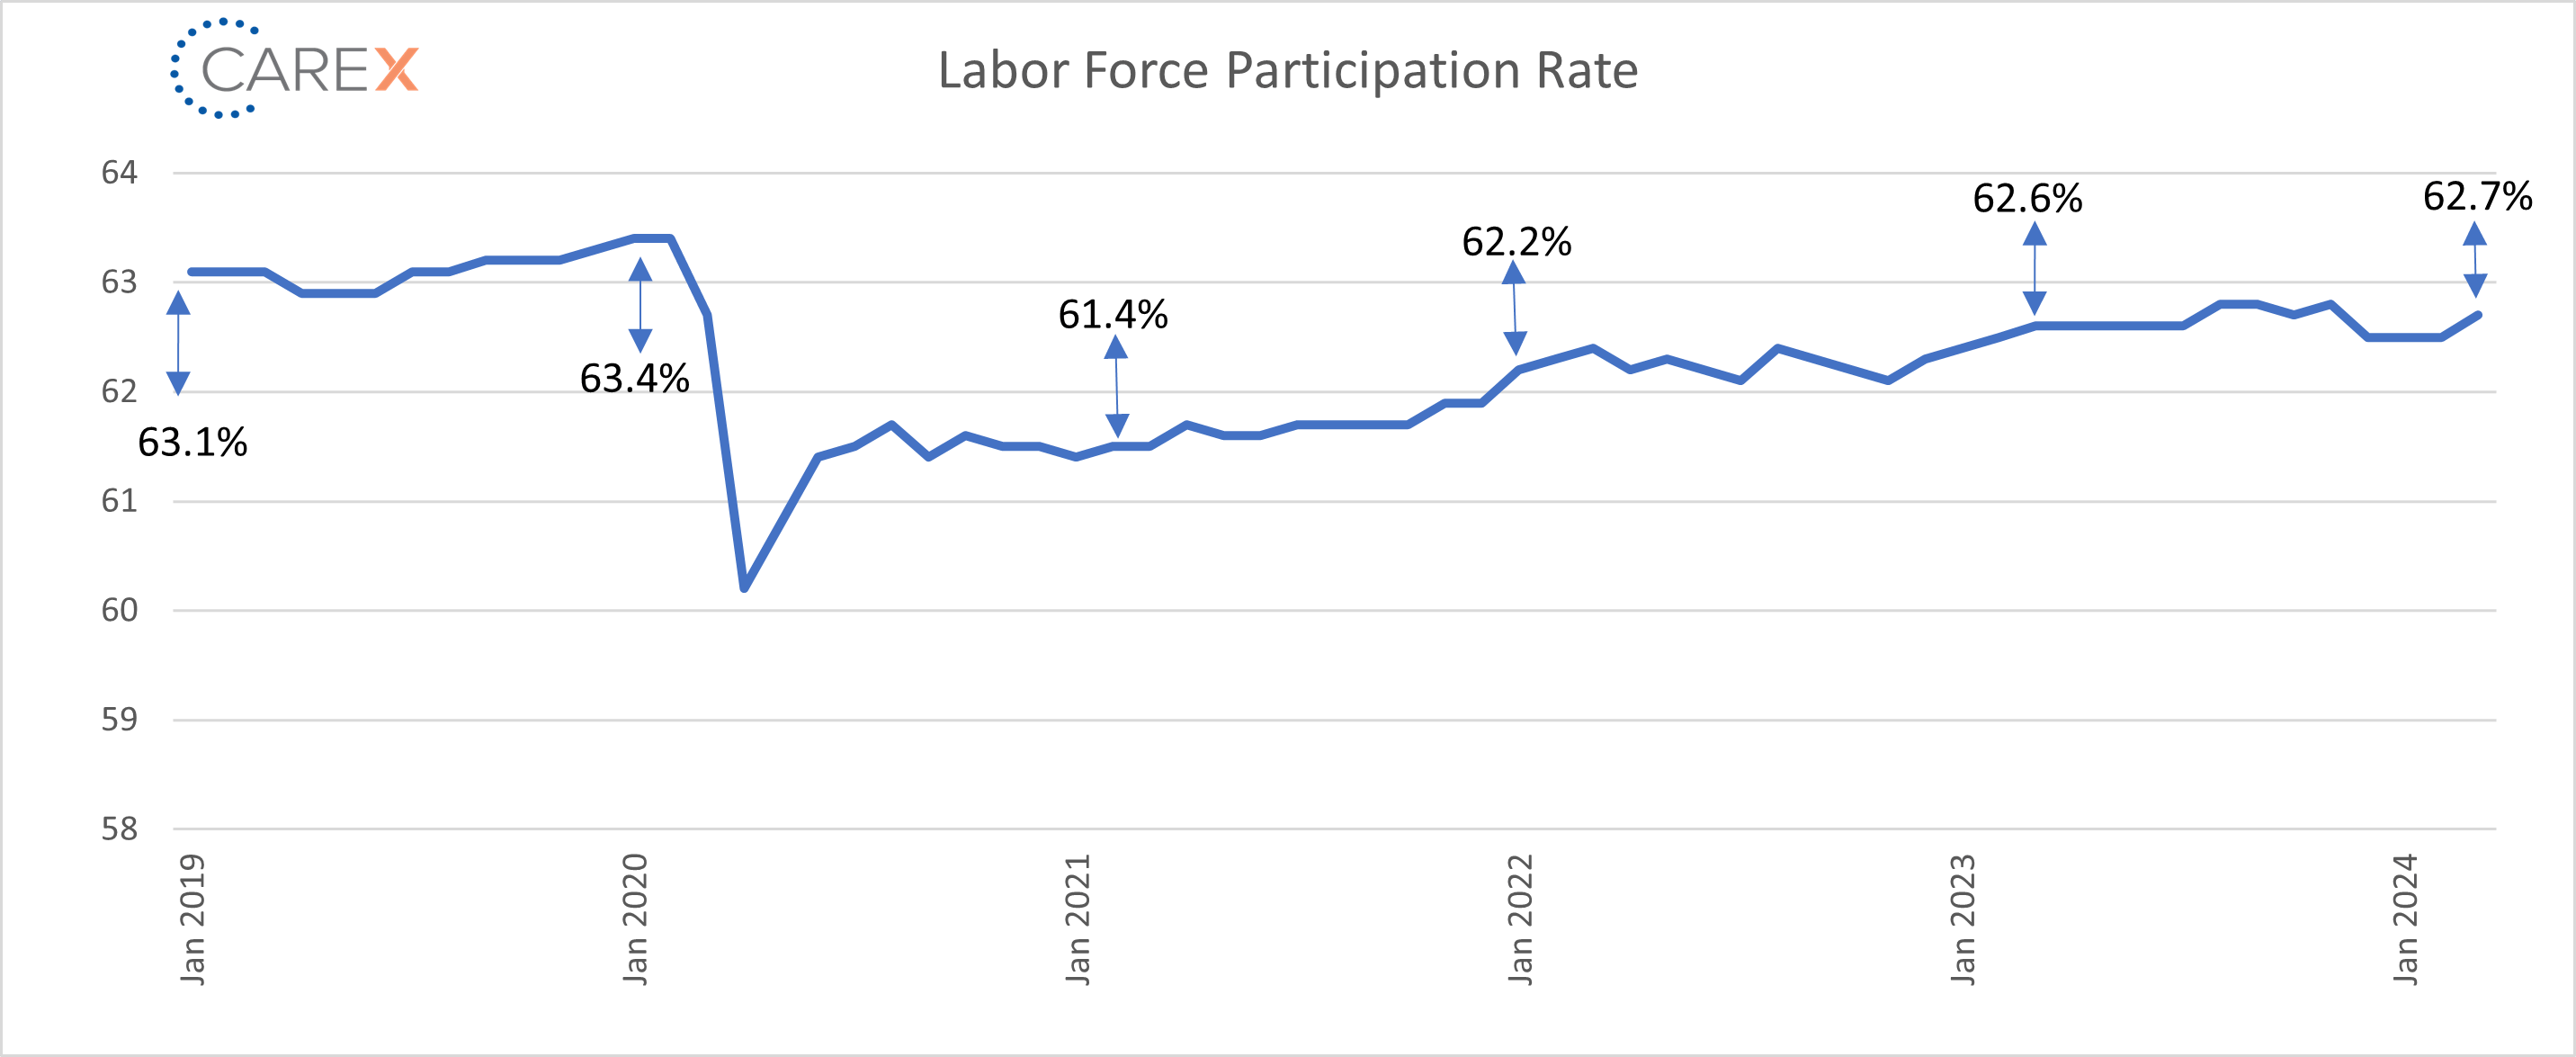
- Labor Force Participation Rate (LFPR) ticked up to 62.7%, rising after three straight months at 62.5%.
- It hit a high of 67.3% in early 2000 and fell to 63.3% in the month before the onset of the pandemic.
To make sure you never miss a Labor Market Insights update, you can subscribe to receive reminders via email here! While you’re here, make sure to check out the other resources we have available.