
Now, here’s our labor market insights for April 2026, written by Matt Duffy:
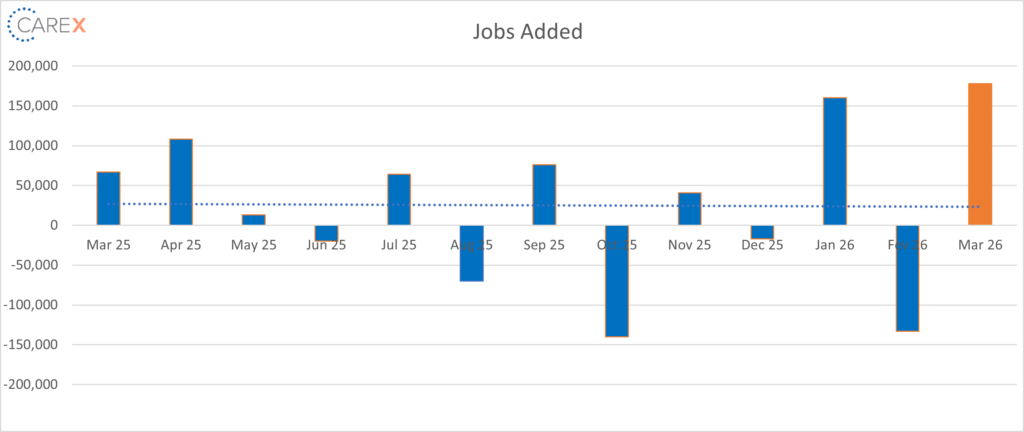
As you may know, I write our monthly Labor Market Insights report on the first Friday of each month. Unfortunately, that timing coincides with the release of the Jobs Report. If you know me, you also know I don’t put a ton of stock in that headline number. Not because it’s meaningless, but because it’s consistently overweighted. It’s the shiny object that grabs attention, even if it doesn’t tell the full story. This month’s headline? We added 178,000 jobs in March. That’s a strong number.
But the devil is in the details.
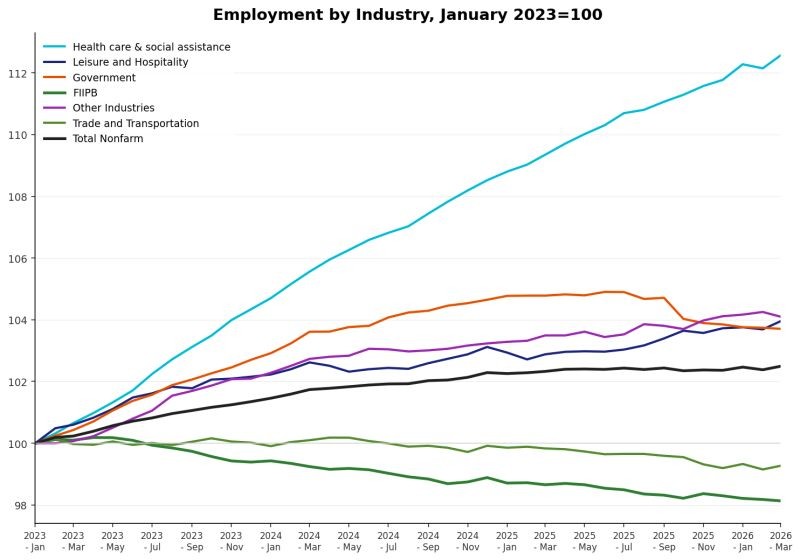
Let’s peel the onion. Healthcare again led job gains in March, adding 76,000 jobs (reflective as many healthcare workers returned from a strike). Construction services added 26,000 jobs; Leisure and Hospitality added 44,000 jobs; and transportation/warehousing added 21,000. Look a little deeper, though, and you’ll see several sectors actually lost jobs. So yes, overall job growth is positive. But we should be cautious about drawing broad conclusions based on a singular number. A handful of industries are doing the heavy lifting, and that’s not fully representative of a broadly strong labor market.
For those of you who like visuals – here’s your chart:
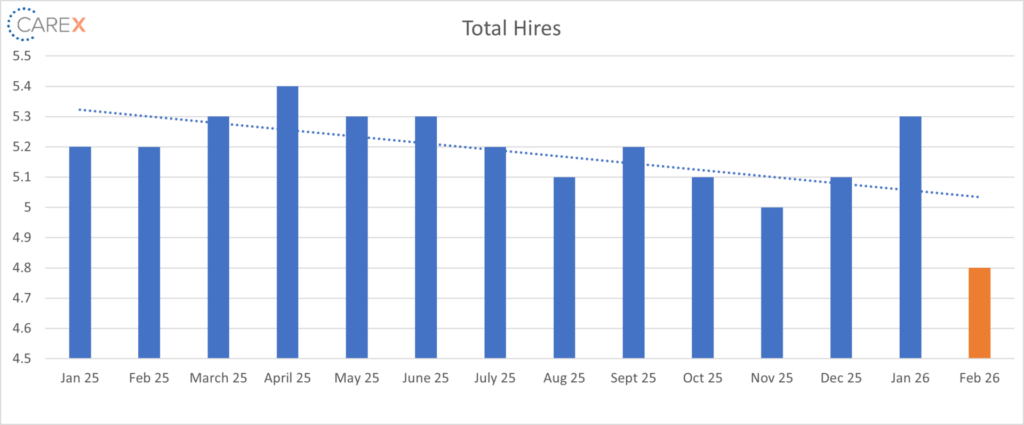
As I worked through this month’s data, one metric stood out – the hiring rate. At 3.1%, it’s very low. The hiring rate measures hires during a period divided by total employment. Comparably, the last time it was this low was April 2020 (remember Covid?). That rate is also comparable to late 2009 and early 2010 (remember the great recession?), when the unemployment rate was around 10%.
Put more simply, if the labor market is a party, the hiring rate is how many new guests are walking in the door. High hiring rate = “Come on in, we’ve got beer and jobs!”. Low hiring rate = “Uh…maybe just stand outside for a bit.” In this scenario, there’s a long line of people trying to get in, but there’s a very serious bouncer at the door. People walk up and say – “I have 5 years of experience!”; “I brought snacks!”. But the bouncer gruffly says, “not tonight”. Translation – there’s lots of people who want jobs (long line), but companies aren’t hiring much (strict bouncer). The low hiring rate is basically a party that looks open, but the bouncer is acting like it’s the VIP section of a yacht in Monaco.
By the Numbers:
- New Jobs – The U.S. added 178,000 jobs in March
- Context provided in the above narrative
- Unemployment dropped to 4.3%, down from 4.4% previous month
- However, long term unemployment has been inching upward, about a quarter of unemployed people were out of work for at least 27 weeks in February
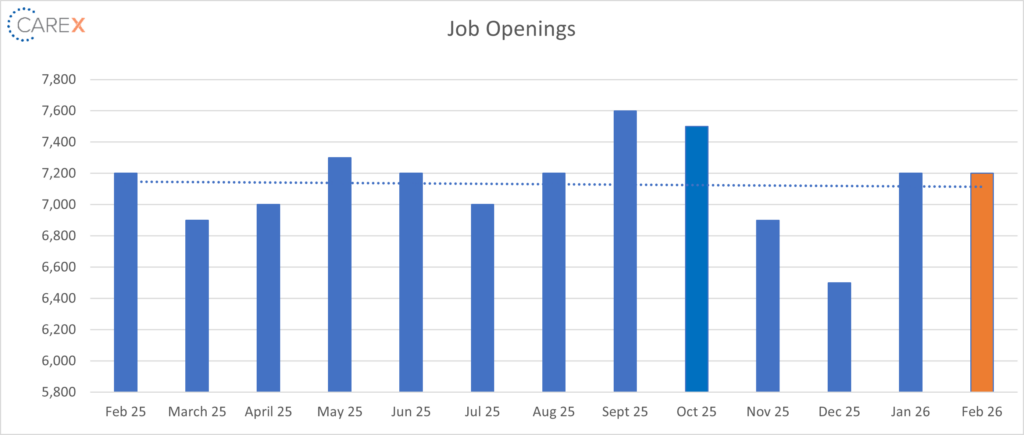
- Job openings remain unchanged at 6.9 million
- Declines in job openings have been especially severe in a few sectors over the past couple of months, including financial activities (~25%) and professional & business services (~22%)
- In 2025, the annual average job openings level was 7.1 million, a decrease of 571,000 from 2024
- Hires dropped to 4.8 million, down from 5.3 million
- Context provided in the above narrative
- Layoffs increased to 1.7 million, up from 1.6 million
-
- The layoff rate sits at 1.1%, the same rate as the fall of 2025
- Quits dropped to 3 million, down from 3.1 million the previous month
- Quits, which are seen as a measure of worker confidence in the ability to change jobs and find another one continues to remain very low
- Total separations dropped slightly to 5 million, down from 5.1 million previous month
- Notably, the number of total separations decreased in federal government (-16,000)
- Jobs per available worker sits at 0.91:1
- At its peak in 2022, the ratio was 2:1
To make sure you never miss a Labor Market Insights update, you can subscribe to receive reminders via email! While you’re here, make sure to check out the other resources we have available.