

New job reports were just released! Here’s our labor market insights for December 2023.
Key Takeaways:
After years of excitement, the U.S. labor market is ready for some boring times. A few months ago, I reported the labor market was cooling from a white-hot level to sweater weather, but it’s not yet cold. It’s definitely cooled enough to throw on a scarf, but again, maybe not quite cold enough for a jacket. If you’ve read my recent summaries, you’ve likely noticed a theme—the labor market is stabilizing. This month is no exception.
While I view the JOLTS/BLS release days like Christmas (but I also like rice cakes and vanilla ice cream—boring!), I realize it’s hard to convince people why it matters, especially when month-over-month trends have normalized. At the risk of repeating myself each month—monthly job growth has trended down, but it’s still well above the minimum number of monthly job gains needed to keep up with population growth, which is somewhere between 70,000 and 100,000 jobs.
I won’t try to create a hook on why this month’s report is notable (because really, it’s not). However, like many things, it’s not what’s right in front of you that matters, it’s what’s around the corner. Like rounding a curve while driving at night, you might see headlights, but they’re so far away, should you care? If the headlights are the Labor Force Participation Rate (LFPR), then yes, you should care (well, maybe not, but I’m trying to convince you to keep reading).
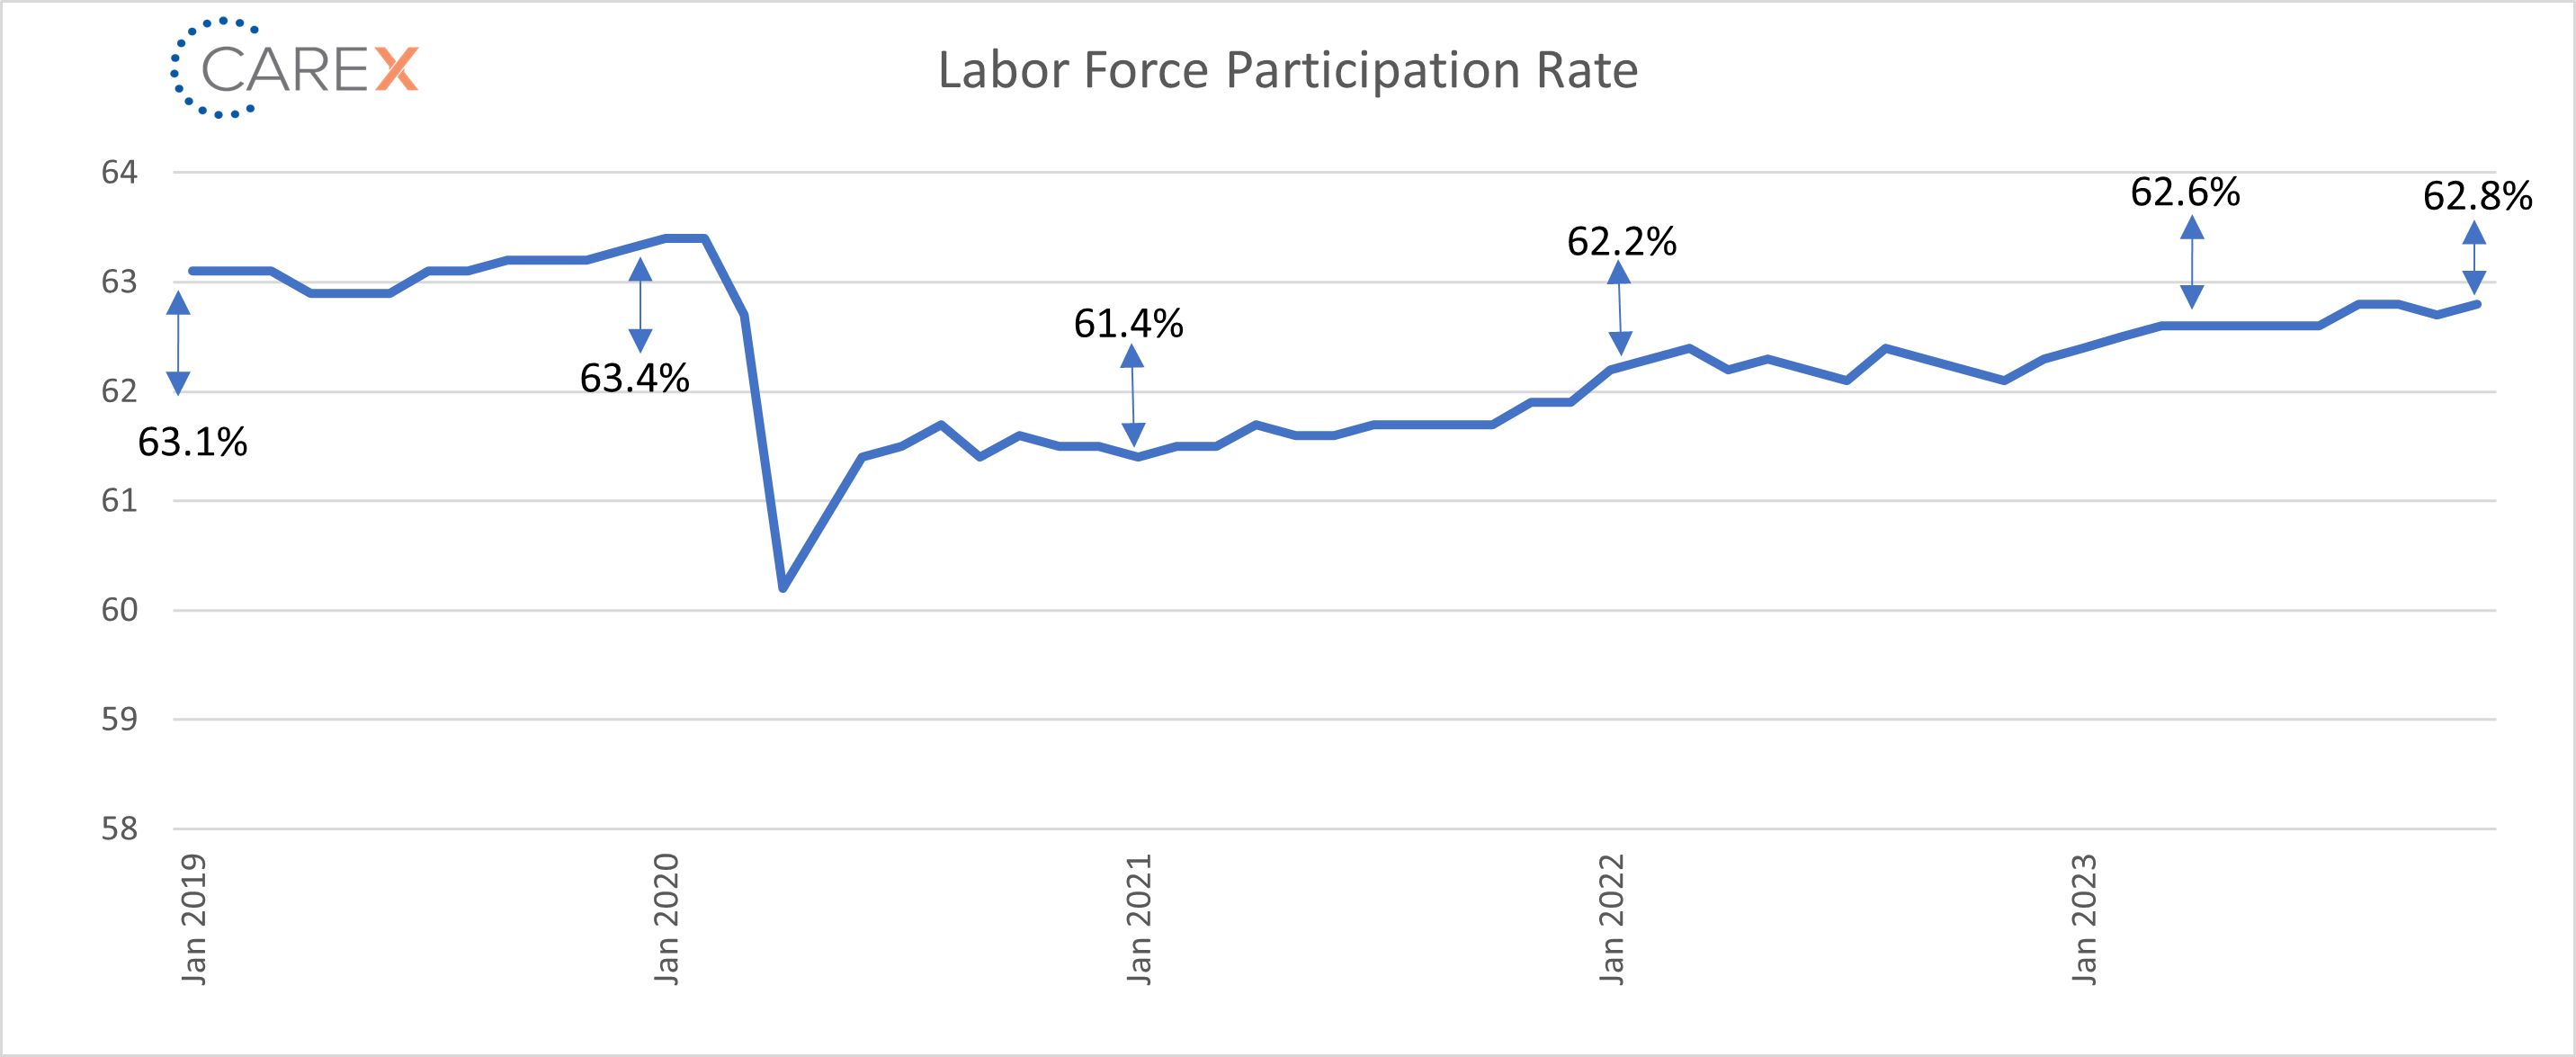
Gad Levanon, Chief Economist at the Burning Glass Institute, recently shared a chart that captured what I’ve tried to articulate about the LFPR for years. The availability of workers is shrinking—a lot, and fast.
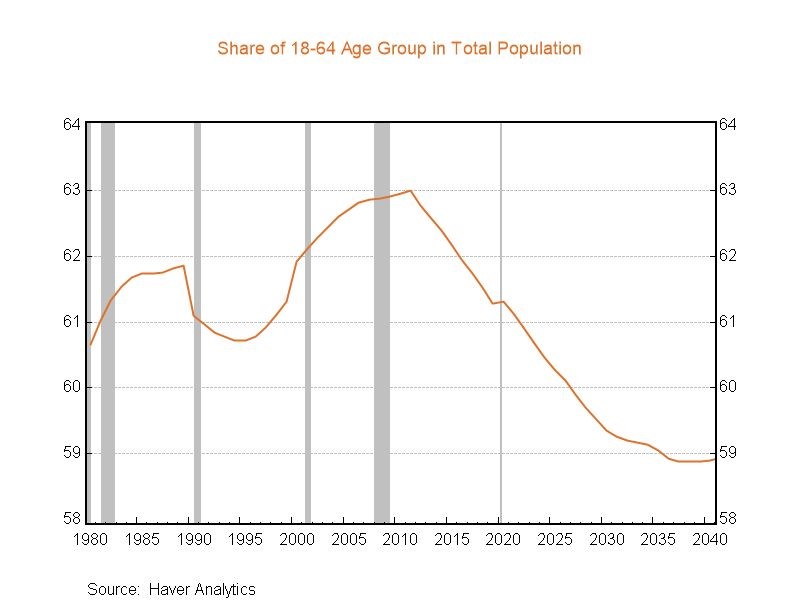
This is significant because the expansion in the workforce has been a major factor in loosening the labor market. However, as workforce growth slows, the labor market will remain tight. I anticipate job growth and hires will remain steady for the foreseeable future. However, even if we see a slower than normal job growth rate, the labor market will likely—counterintuitively—tighten given the slack in the LFPR. If you read these reports, you either have a weird affinity to labor market data (like me), or you’re in a position that is impacted by hiring and/or retention. The LFPR “headlights” offer a cautionary headline about the changing labor landscape. Not only is AI and technology changing the type of jobs in the market, the declining working age population is adding another variable in the already rapidly changing labor market.
This month’s data points are referenced below. However, keep in mind that declining hiring has played a far bigger role in the cooling labor market than rising layoffs. This is good news and reinforces the notion that we’re approaching a “soft landing.” The next question is: if we experience a soft landing, how far is the runway? Maybe I’ll address that next month!
By the Numbers:
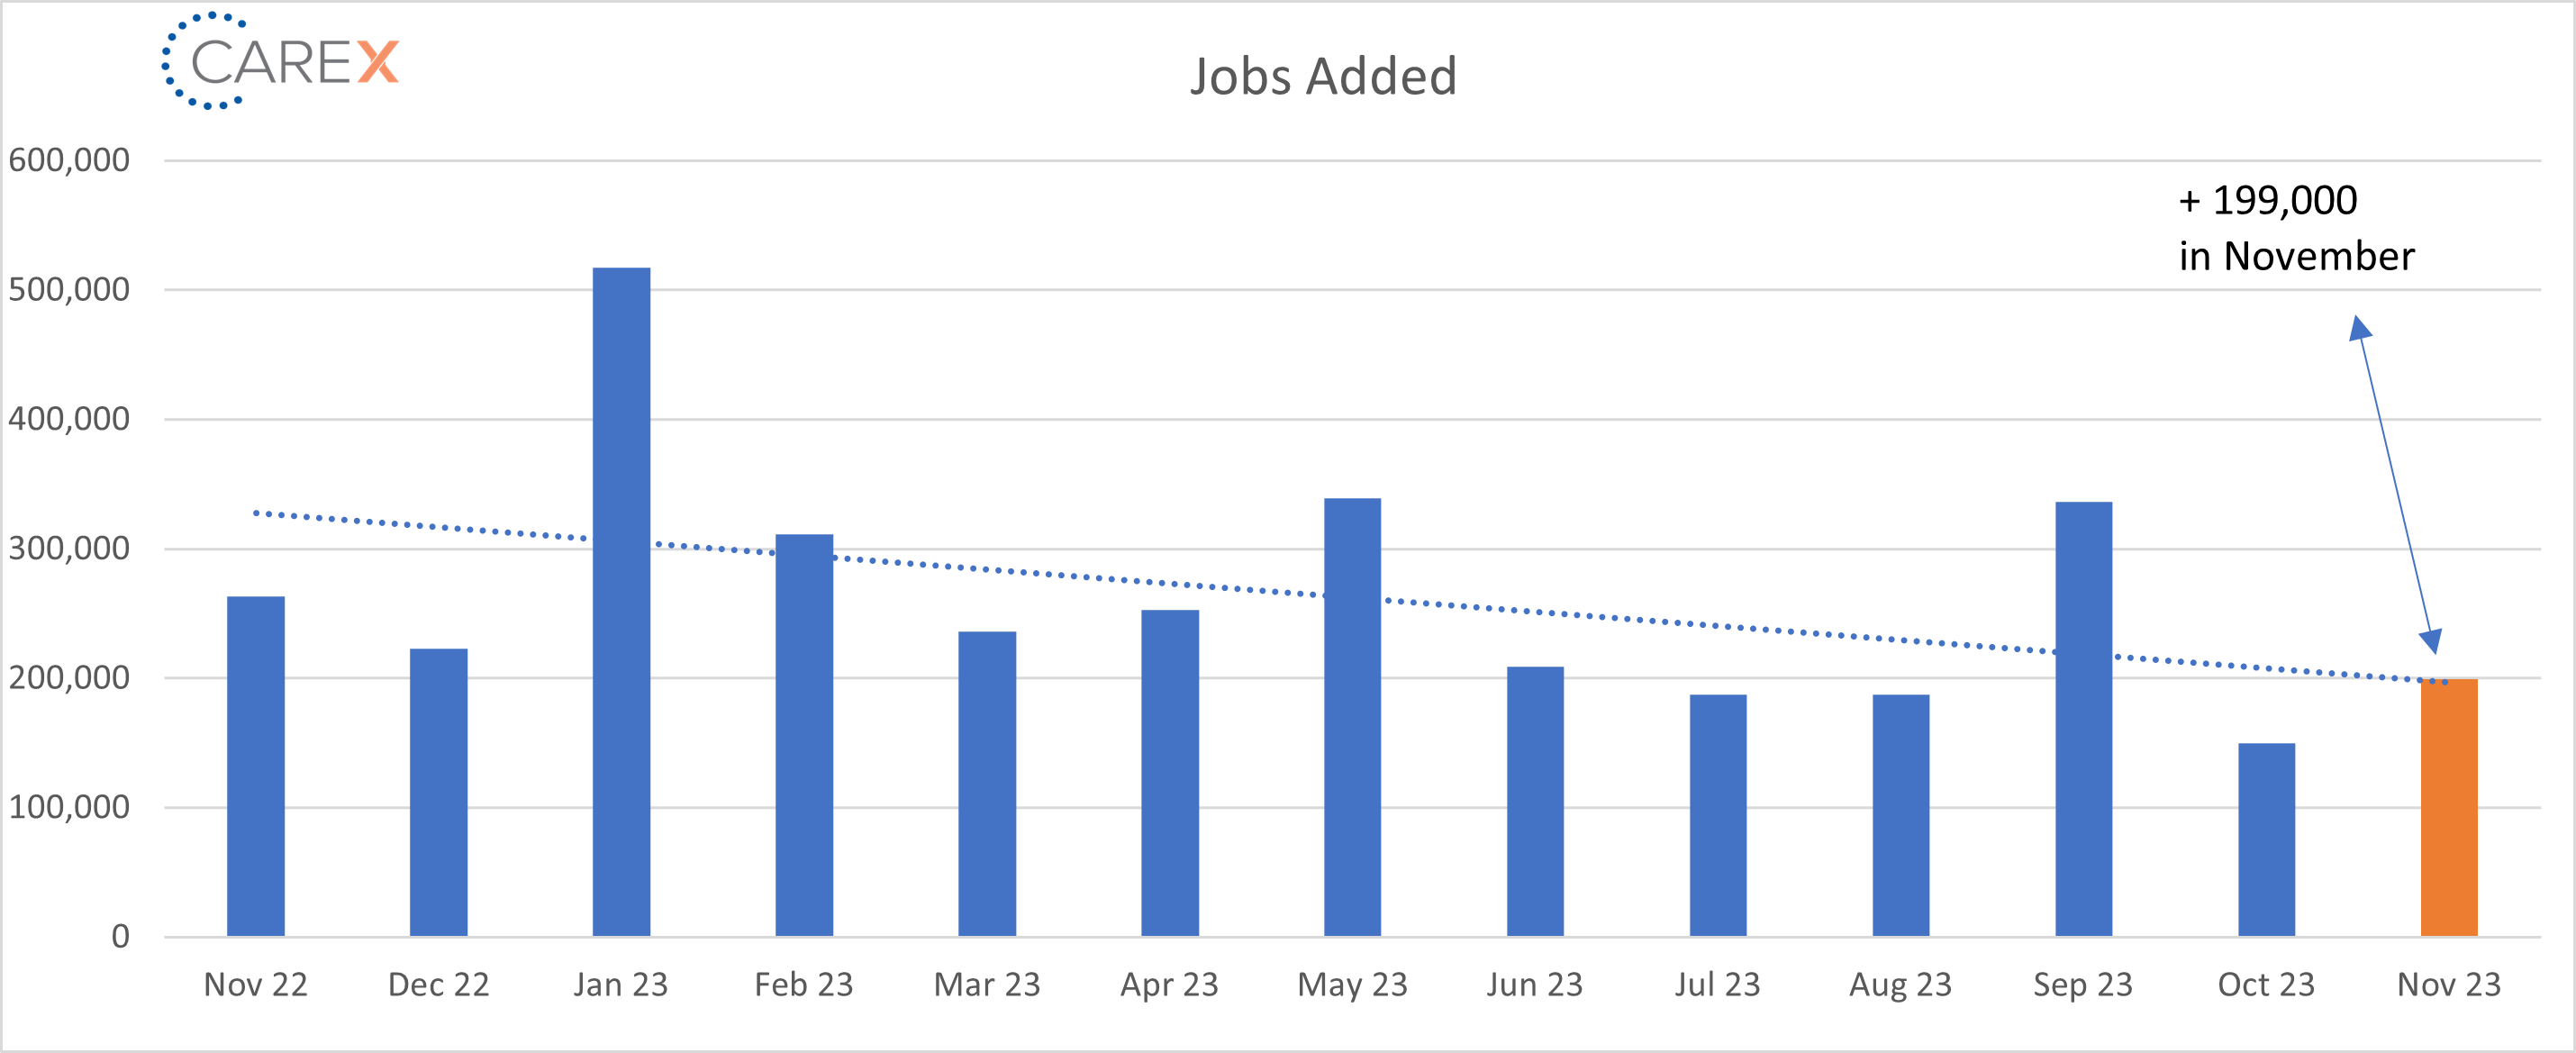
- New Jobs – The U.S. added 199,000 new jobs in November. A surprising increase from last month’s addition of 150,000 new jobs. However, it represents a significant drop from October’s gain of 336,000 jobs (chart above).
- Through November, the economy has added an average of 232,000 jobs per month.
- Notable job gains occurred in health care, government, and manufacturing; while employment in retail declined.
- Unemployment fell to 3.7%, a drop from last month’s rate of 3.9%.
- Unemployment has held steady over the past several months.
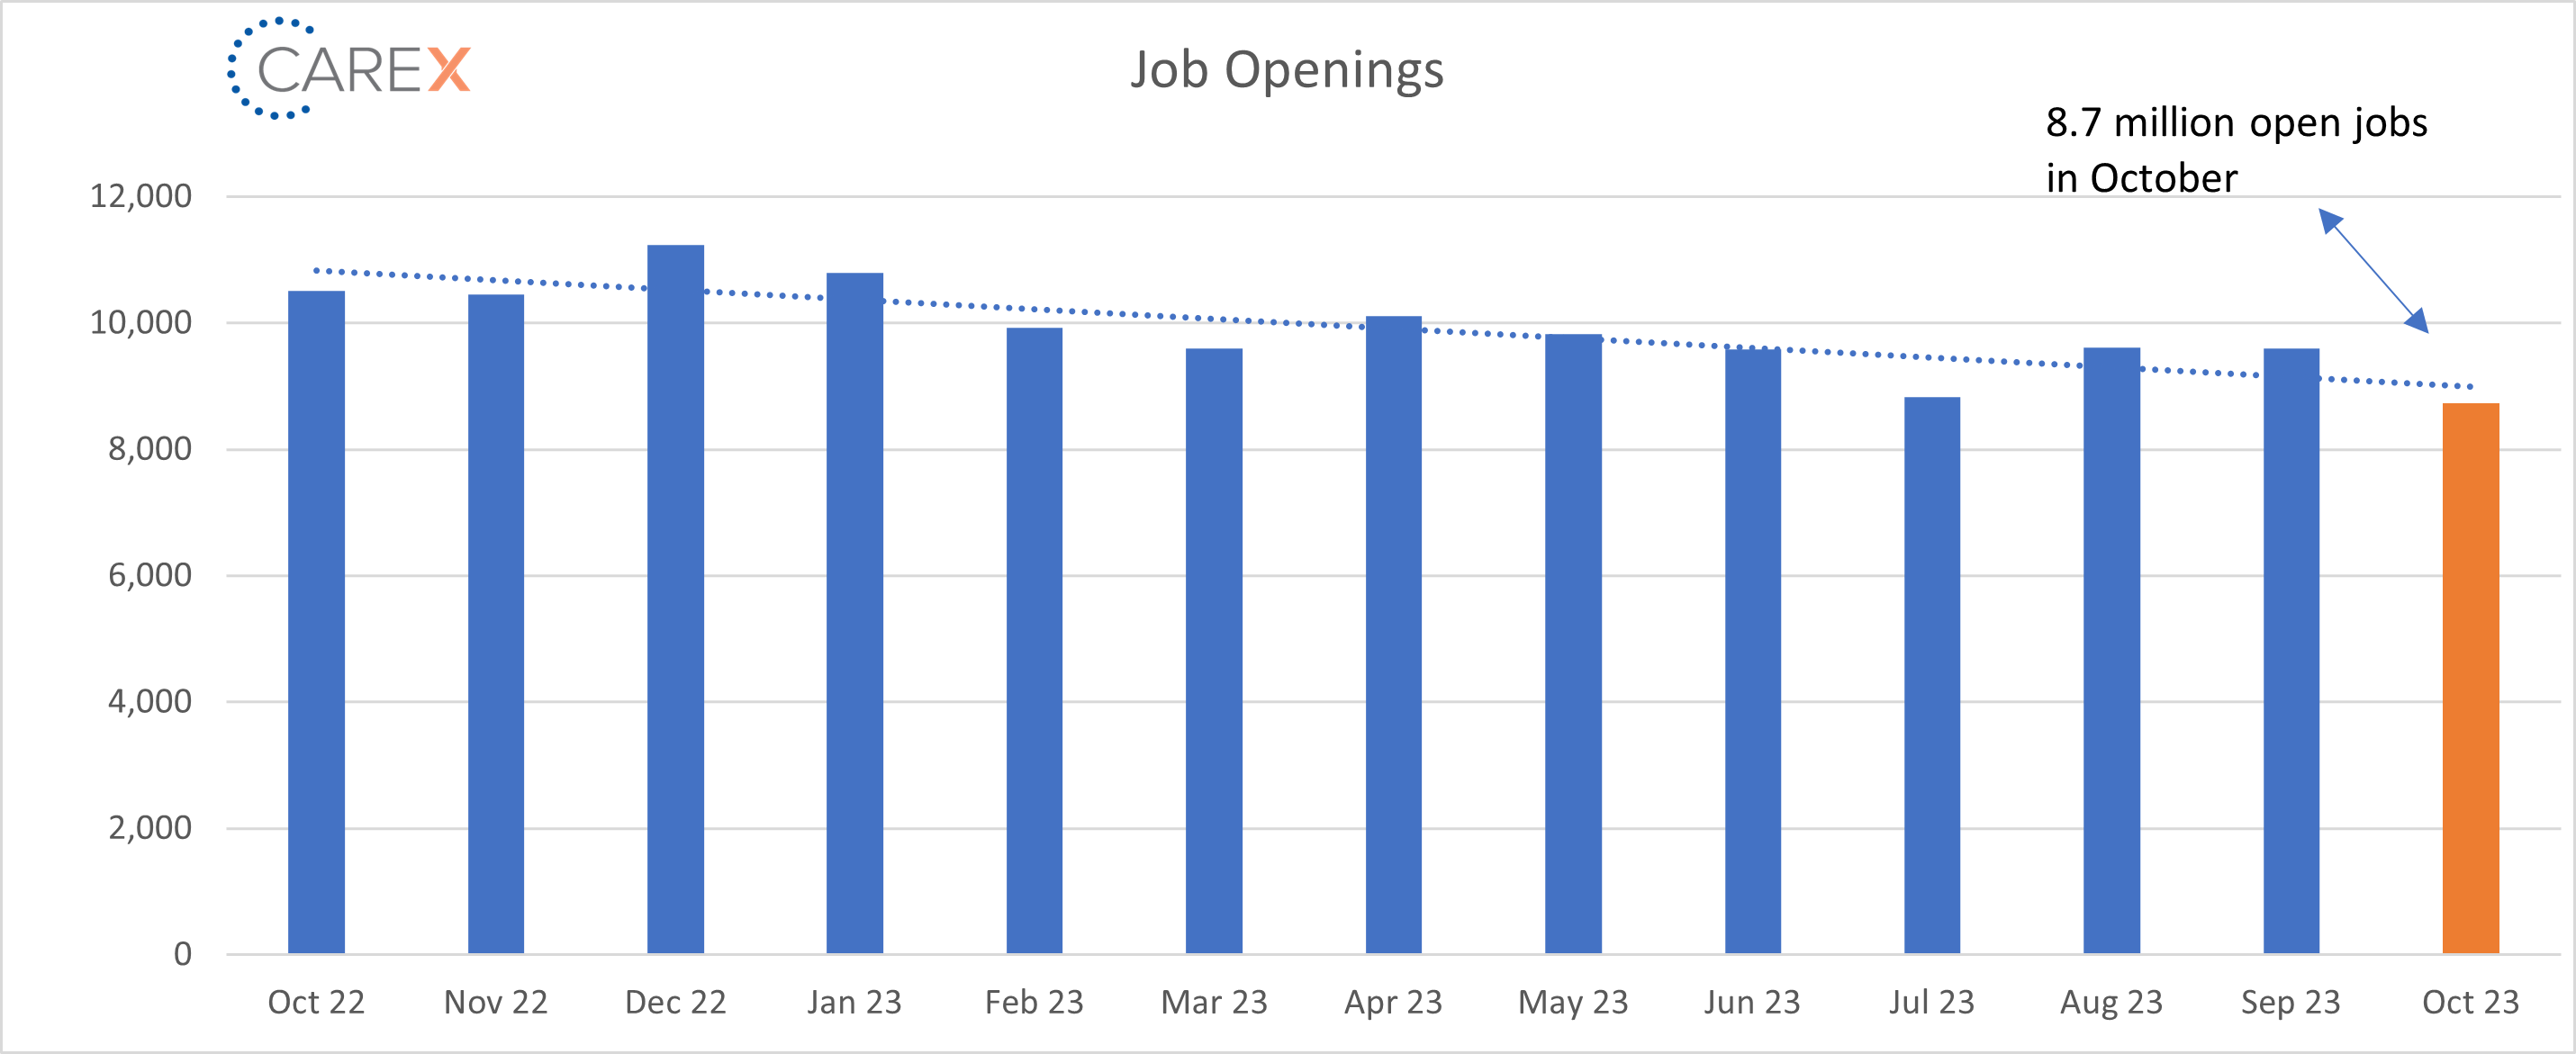
- Job openings slid to 8.73 million, a noticeable decline from last month’s rate of 9.6 million open jobs (chart above).
- The lowest level since March 2021.
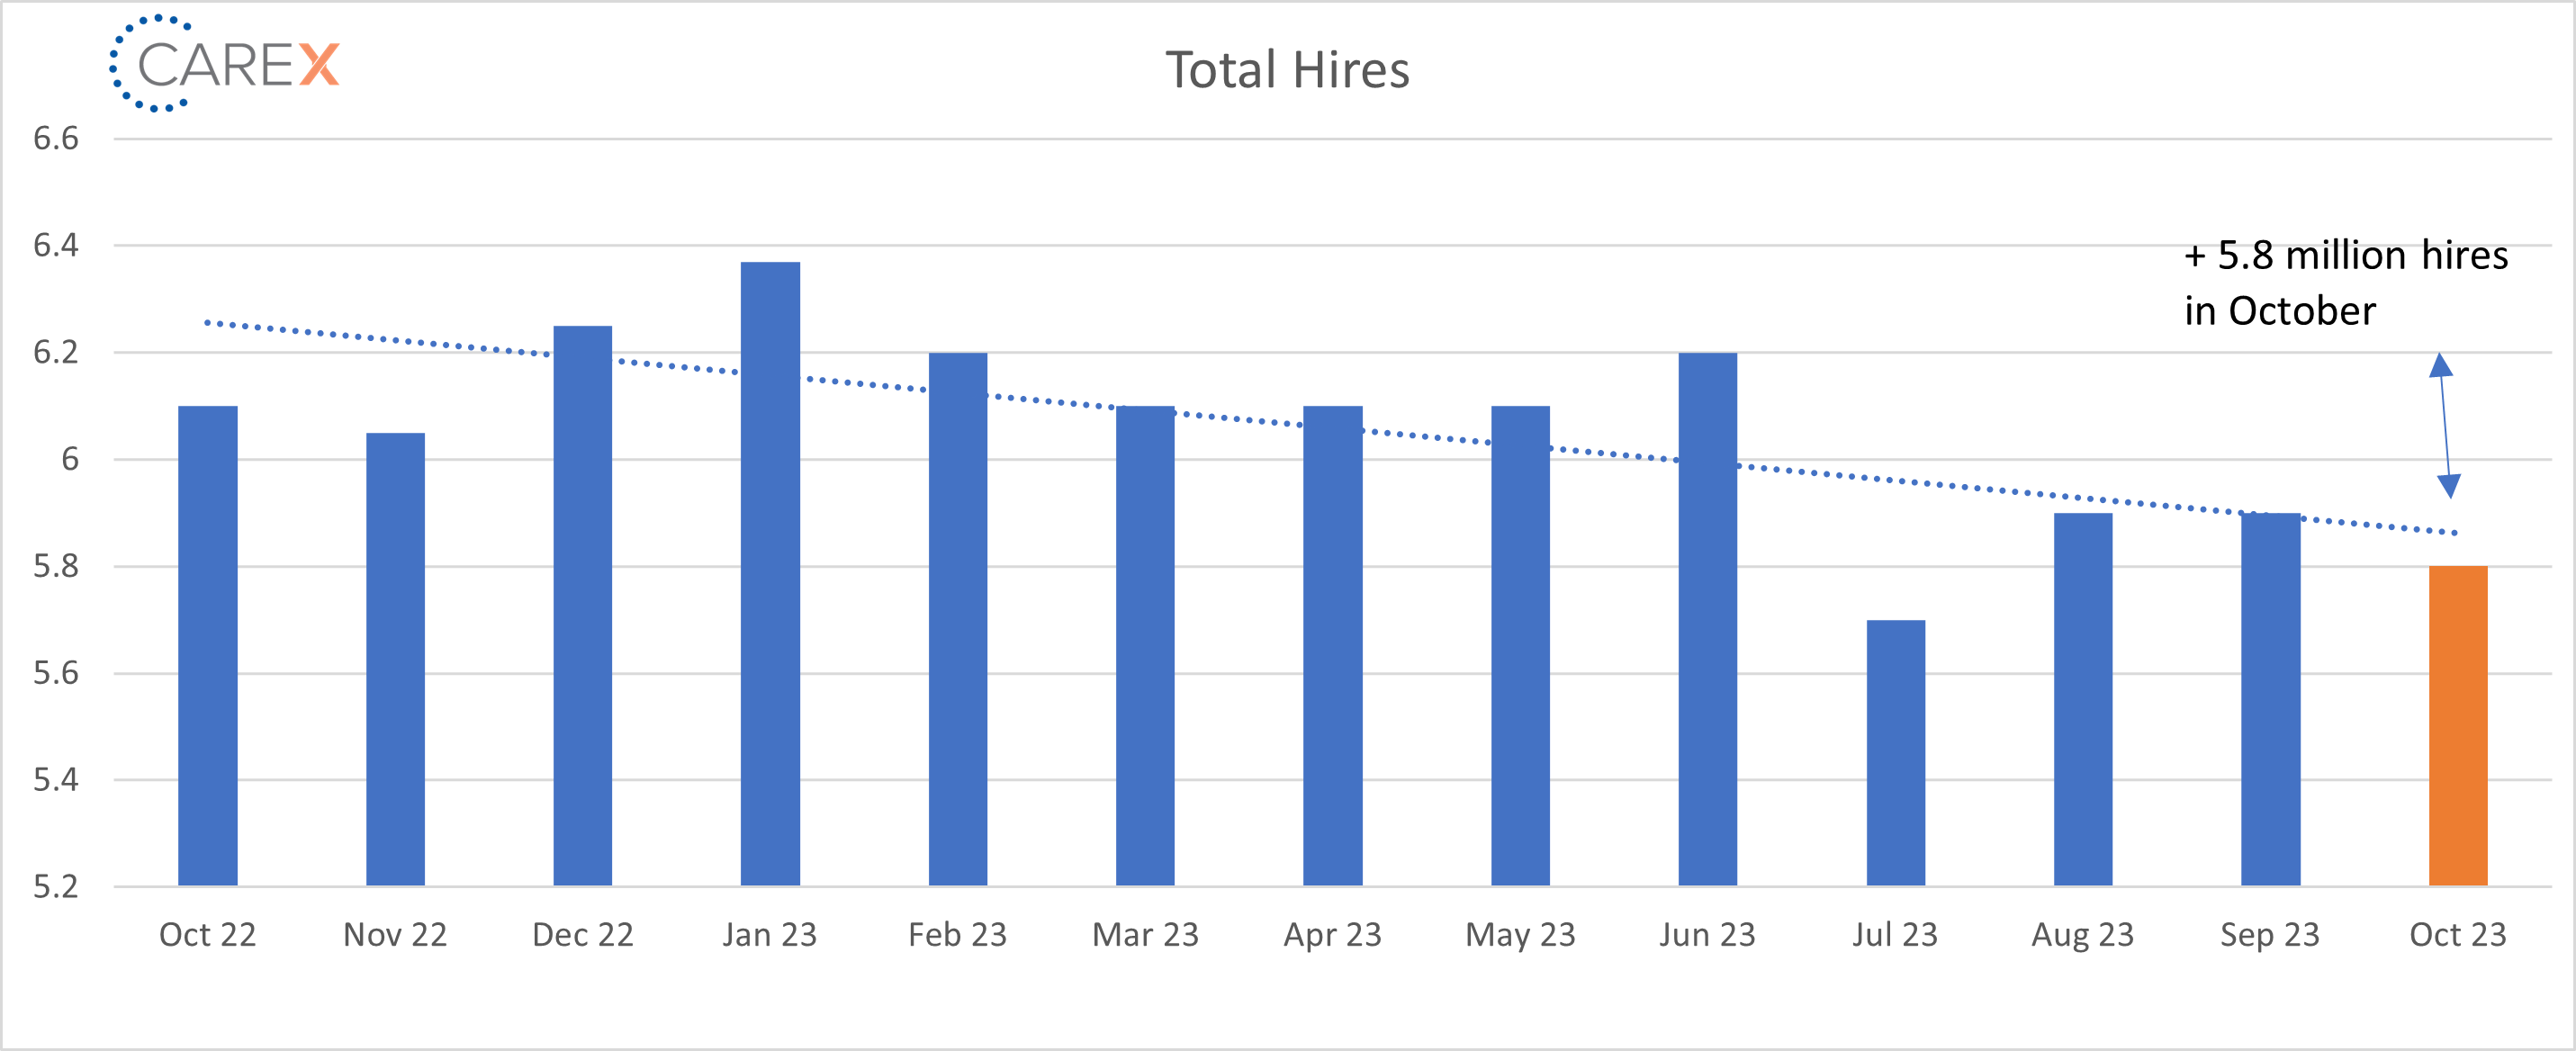
- Hires remained steady at 5.8 million, a slight drop from 5.9 million last month (chart above).
- Layoffs increased slightly to 1.6 million, up from 1.5 million the previous month, but down from 1.7 million two months ago.
- The number of layoffs remain very low by historical standards.
- Quits – The number of people quitting their job decreased slightly to 3.6 million, a slight drop from 3.7 million the previous month.
- Quits, which are seen as a measure of worker confidence in the ability to change jobs and find another one, continue to remain very steady—and very low.
- The quit rate had peaked around 3% of total employment in late 2021 into early 2022, during what briefly was known as the Great Resignation as workers left their old jobs in search of positions that paid more and offered better working conditions; it since has declined to 2.3%.
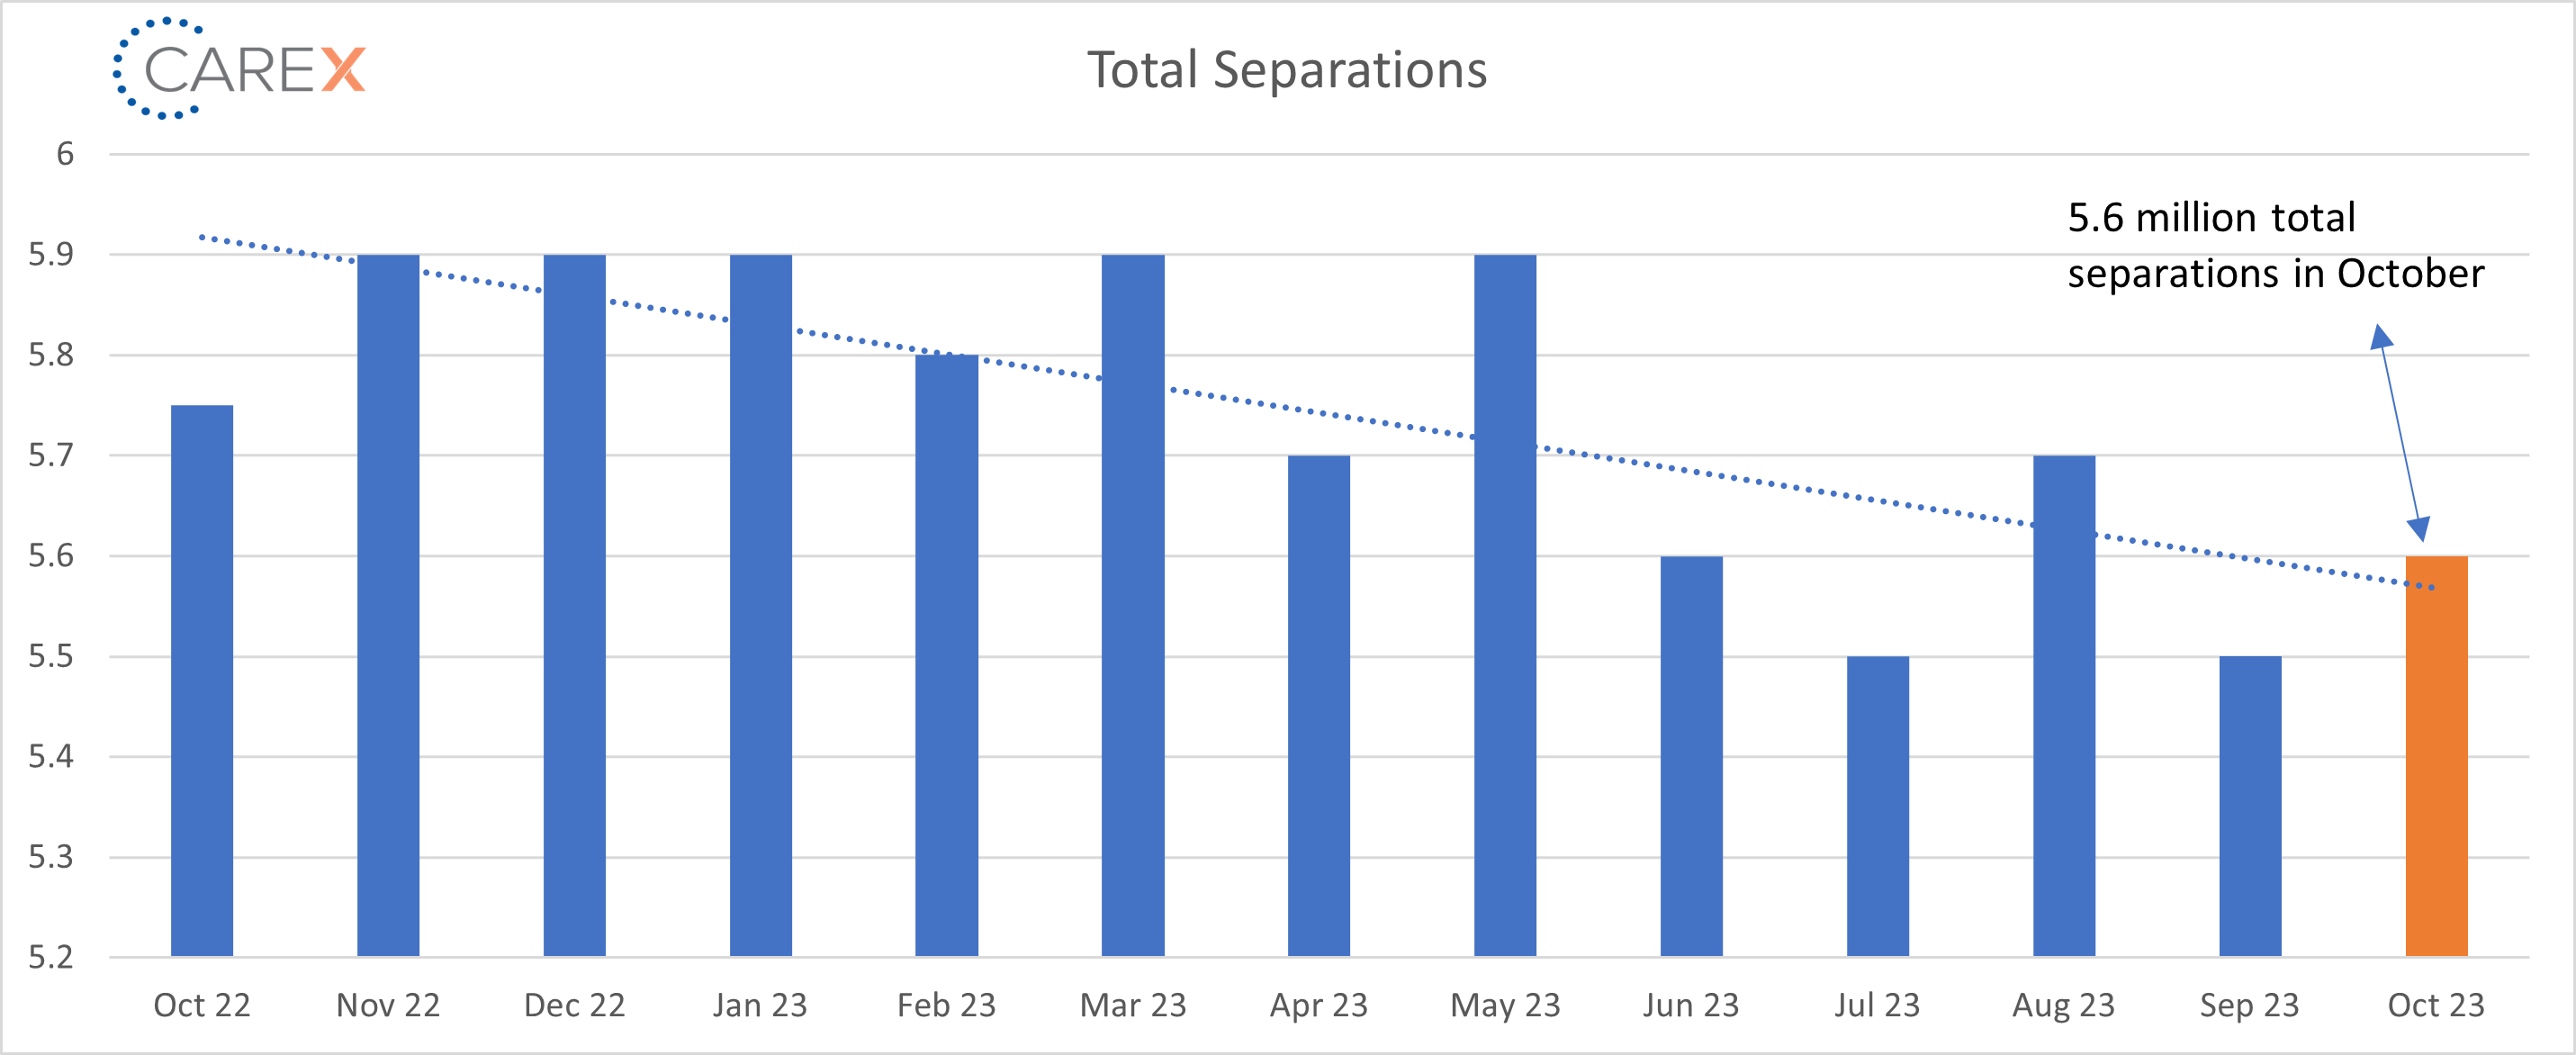
- Total separations increased slightly to 5.6 million, a very small increase from last month’s number of 5.5 million, down from 5.7 million two months ago (chart above).
- Jobs per available worker fell to 1.3:1, a drop from last month’s ratio of 1.6:1, and noticeably down from 1.8:1 just six months ago.
- This ratio averaged ~2:1 over the past 2 years.
- Labor Force Participation Rate (LFPR) ticked up to 62.8%, a slight increase from last month’s mark of 62.7%.
- The share of prime working age Americans with a job is only 1.1 percentage points away from the all-time record attained in April 2000.
To make sure you never miss a Labor Market Insights update, you can subscribe to receive reminders via email here! While you’re here, make sure to check out the other resources we have available.