
Now, here’s our labor market insights for January 2026, written by Matt Duffy:
January arrives full of promise and anticipation – and, of course, New Year’s resolutions. Mine include:
- Eat more vegetables (potatoes count, emotionally).
- Stop saying “this week is crazy” every single week.
- Say “no” without attaching a full paragraph of justification.
- Spend less time replaying conversations from 2014.
- Stop relying on “because I said so” as my primary parenting philosophy.
January is also the month of predictions. After two decades of forecasting what’s ahead, I’ve learned one very important lesson: I can’t predict anything. Much like my resolutions, predictions often amount to useless data – taking up space in a yet-to-be-built data center.
So, here’s my only labor market prediction: it will change. That much I can guarantee.
Instead of looking forward, let’s look backward. There are a few key data points that explain the headlines about a “deteriorating labor market” and help frame what might happen next. Specifically, I’ll focus on three metrics:
- Layoffs
- Job creation
- The hiring rate
Layoffs
A common refrain last year was, “Layoffs are relatively low this month.” What I failed to appreciate at the time was that we were slowly boiling the frog. There wasn’t an episodic event; it was the persistence that did the damage. According to Challenger, Gray & Christmas, employers announced 1,206,374 job cuts in 2025, a 58% increase from 2024. That marks the highest annual total since 2020 and the seventh-highest year for layoffs since 1989.
Historically, it’s easy to point to a clear catalyst for elevated layoffs. Looking at the years with higher totals:
- 2020 (2.3M): COVID
- 2001 (1.9M): Dot-com crash + September 11
- 2002 (1.4M): Lingering dot-com effects and 9/11
- 2009 (1.28M): Great Recession
- 2003 (1.23M): Automation and early mobile technology disrupting manufacturing and other sectors
- 2008 (1.22M): Great Recession
- 2025 (1.2M): …less obvious
There isn’t a single, clean explanation for 2025. Instead, three variables seem to matter most – (1) Artificial intelligence—yes, AI is impacting the labor market; (2) Tariffs; and (3) DOGE.
It’s reasonable to assume tariffs and DOGE-related effects may stabilize. AI? Buckle up. That ride is just getting started.
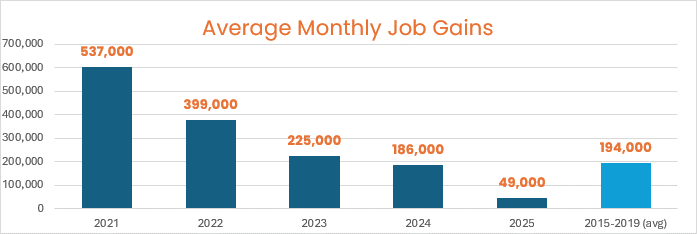
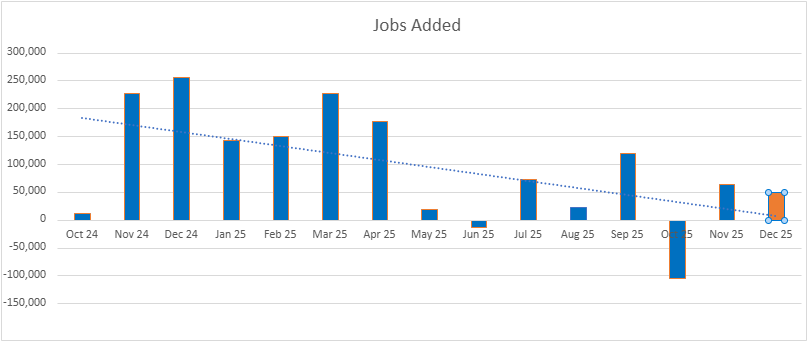
Job Creation
Sometimes a chart says more than words. I’ll leave it at that.
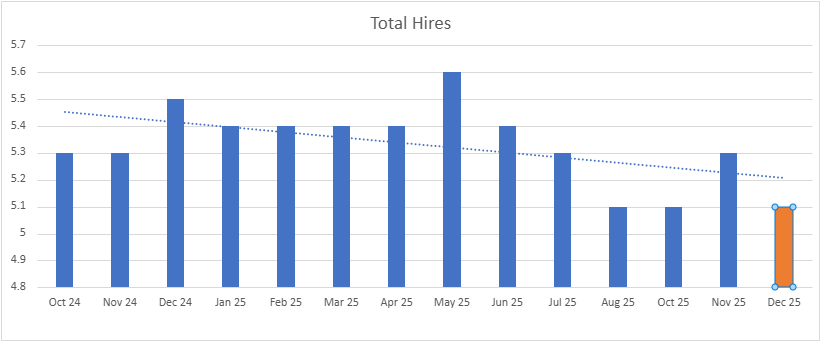
The Hiring Rate
This is the most important data point of all. Job creation, job openings, and headlines don’t matter much if companies aren’t actually hiring, and that was the defining story of 2025. The hiring rate hovered around 3.1–3.2% for much of the year. By historical standards, that’s very weak. In practical terms: it’s hard to find a job. These levels are comparable to the period coming out of the Great Recession when unemployment exceeded 9% (more than double where it stands today).
By the Numbers:
- New Jobs – the U.S. added 50,000 new jobs in December
- Save for 2020, last year ranks as the poorest year for job creation since 2009 and the global financial crisis
- Job gains in December were largely driven by food services, health care and social assistance
- Unemployment fell to 4.4%, down from 4.6% the previous month
- The decline was due in part to adjustments applied by the BLS, so take the decline with a grain of salt
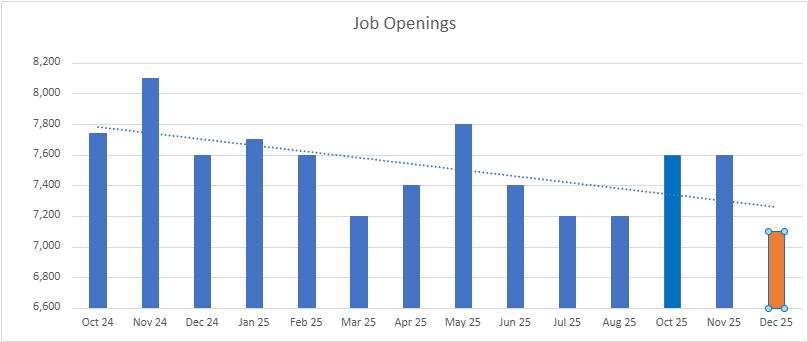
- Job openings fell to 7.1 million, down from 7.6 million the previous month
- The number of job openings decreased in accommodation and food services (-148,000); transportation, warehousing, and utilities (-108,000); and wholesale trade (-63,000)
- Hires remained steady at 5.1 million, down from 5.3 million two months ago
- The hiring rate remains stuck at levels last seen in 2013, when the U.S. economy was still emerging from the Great Recession
- Layoffs dropped slightly to 1.7 million, down from 1.8 million the previous month
-
- The layoff rate has moved upward very slowly, over the past few months the layoff rate has ticked up to 1.2%, compared to 1.1% this fall
- Quits increased 3.2 million, up from 2.9 million the previous month
- Quits, which are seen as a measure of worker confidence in the ability to change jobs and find another one continues to remain very steady – and very low
- Total separations remain unchanged at 5.1 million, down from 5.2 million two months ago
- Total separations are down primarily because of the extremely low quit rate
- Jobs per available worker remained steady at 0.99:1
- At its peak in 2022, the ratio was 2:1
To make sure you never miss a Labor Market Insights update, you can subscribe to receive reminders via email! While you’re here, make sure to check out the other resources we have available.