
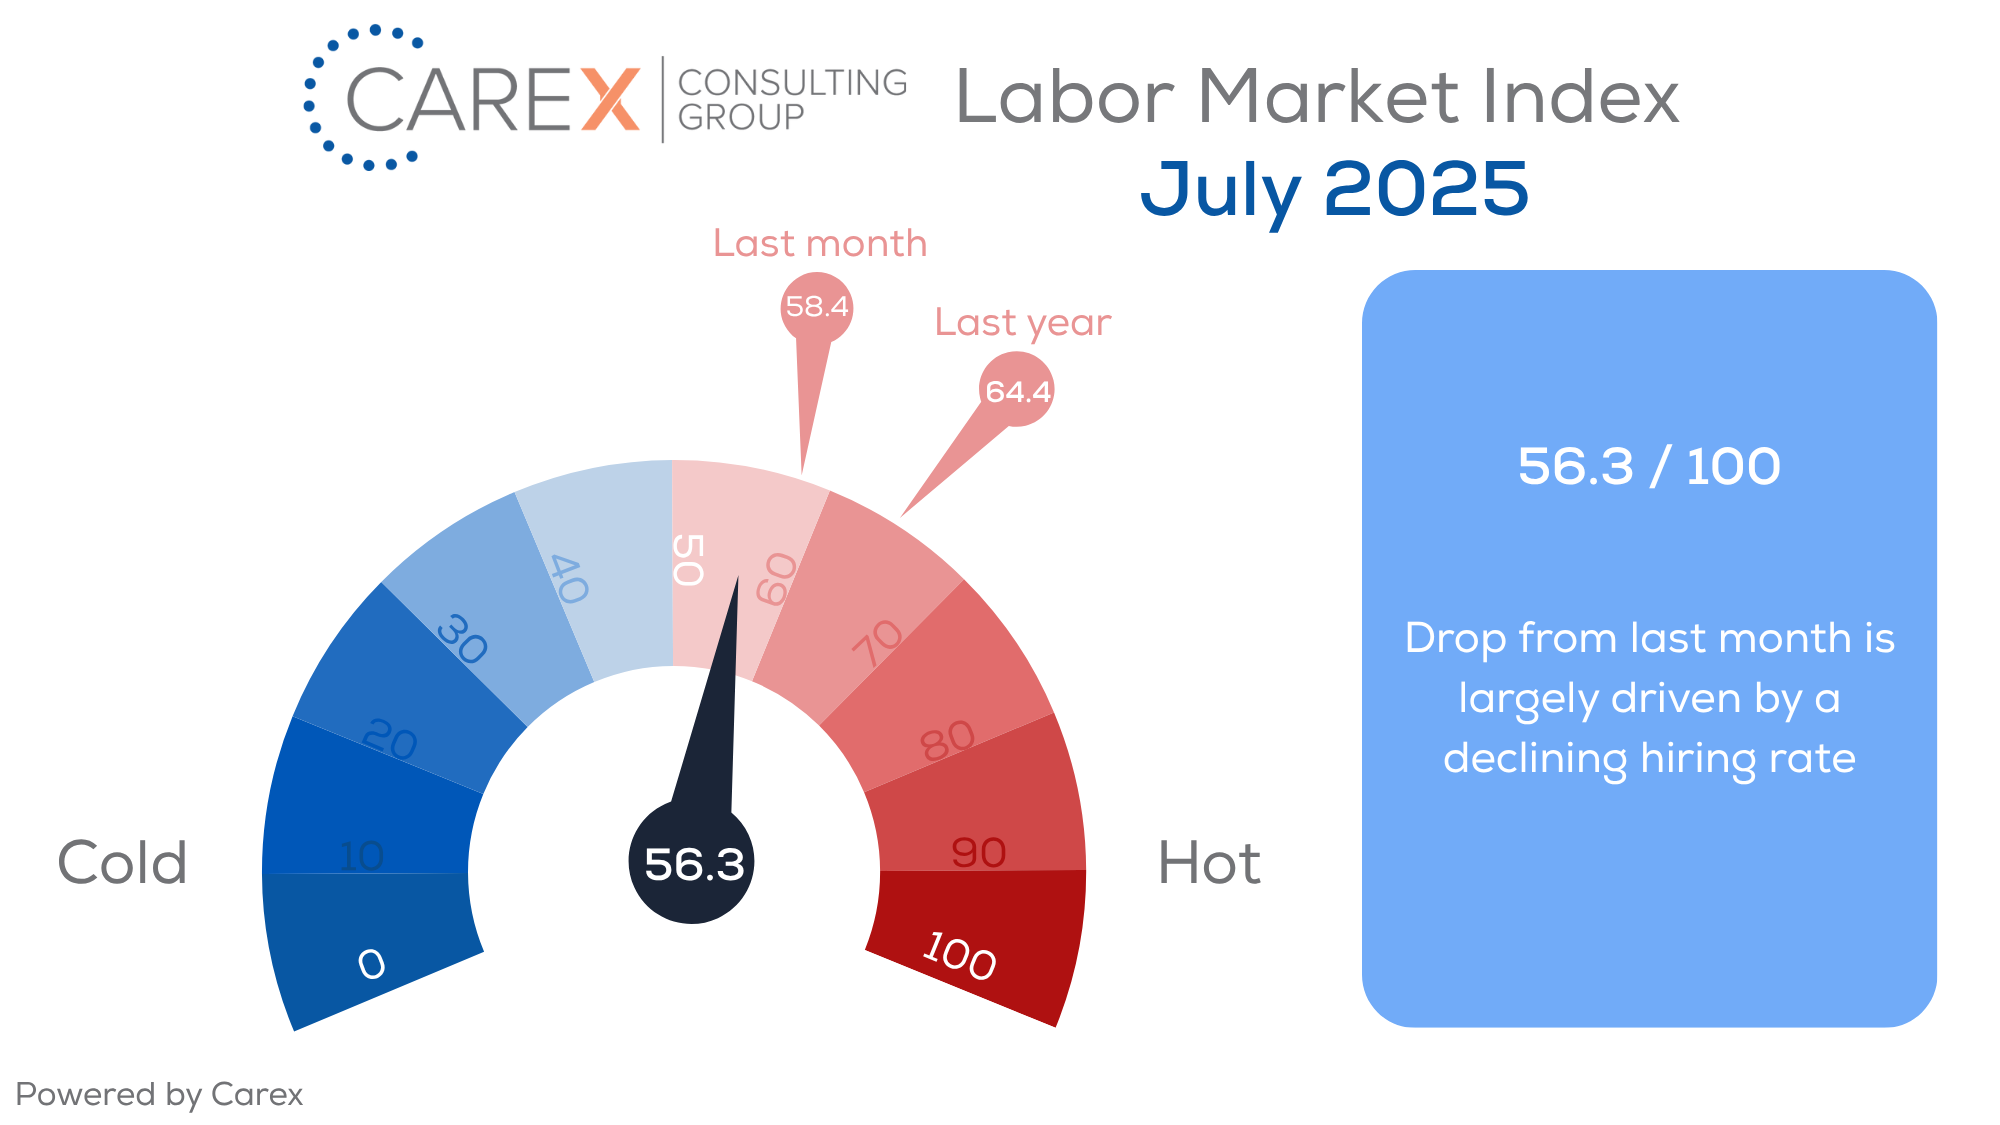
Now, here’s our labor market insights for July 2025 written by Matt Duffy:
Key Takeaways:
I’d be remiss if I didn’t start by throwing some shade on the new jobs report. Headlines are touting a surprisingly strong jobs report. The U.S. added 147,000 jobs in June – on the surface, this is very strong. However, job growth is not widespread – the vast majority of the gains were in just three sectors: health care (+58,600 jobs), leisure and hospitality (+20,000 jobs), and state and local government (+80,000 jobs). Outside of public sector gains, private sector businesses added only 74,000 jobs in June, the smallest monthly gain since October 2024.
Everyone has a fear or phobia. For some, it’s a fear of enclosed spaces, flying, or spending a week with your in-laws. For me, it’s mountain driving (which is unfortunate, because the mountains are my happy place). I just returned from a family vacation in the mountains – and of course, we drove. Leading up to the trip, I was nervous. As we drove, I could see the mountains approaching, and I became even more nervous. Then I started to drive up the mountain (one lane road, steep incline, hairpin turns – all with a massive drop off with no guardrails!). Not surprisingly, I survived and everything was ok. Often, the anticipation – or uncertainty – is worse than the experience itself.
The labor market is no exception. Headlines continue to show a stable and resilient labor market (unemployment remains low, healthy job growth, and layoffs are minimal). However, the pulse of the actual labor market feels more unstable. Like me driving toward a mountain, I sense it’s the fear of what’s ahead that is creating much of our anxiety. The following two graphs signify why some folks feel like they’re about to drive on a mountain road (or spend a week with your in-laws!).
At the most simplistic level, if you want a gauge of where the Labor Market is moving – the distance between the below orange and blue lines is a nice visualization (in short: we want these lines to be close together, or at a minimum, not to continually move away from each other, a continual widening gap signifies trouble ahead). As you’ll note, in both cases, the lines are moving in the wrong direction.
National Hiring and Unemployment is painting a picture of a widening gap of two key data points:
- The most concerning data point these days is the hiring rate, showcasing a reluctance from many organizations to hire new staff
- The hiring rate remains stuck at levels last seen in 2014, when the U.S. economy was still emerging from the Great Recession
- While unemployment remains relatively low, the low rate of hiring is compounding the frustration of job seekers – it’s a tough market to find a new job

The Labor Supply and Demand chart (originated from Gad Levanon with the Burning Glass Institute) tells us that:
- Labor Demand (employment + job openings) has been growing slowly since the pandemic; however, it’s starting a downward decline
- Labor Supply (employed + job seekers) continues to increase
- Should the orange Demand line continue to slide, this will put significant – and continued – pressure on job seekers, ultimately spiking unemployment numbers

By the numbers:
- New Jobs – the U.S. added 147,000 jobs in June, up slightly from 144,000 new jobs created in May
- Job growth is not widespread – the vast majority of the gains were in health care (+58,600 jobs), leisure and hospitality (+20,000 jobs), and state and local government (+80,000 jobs)
- Stripping away the public sector gains, US private sector businesses added only 74,000 jobs in June, the smallest monthly gain since October 2024
- The three-month average job growth is at 150,000
- Unemployment dropped slightly to 4.1%, down from 4.2% the previous month
- The rate is higher than the 50-year low of 3.4% seen in April 2023, but lower than the rates observed in previous years leading up to the Pandemic
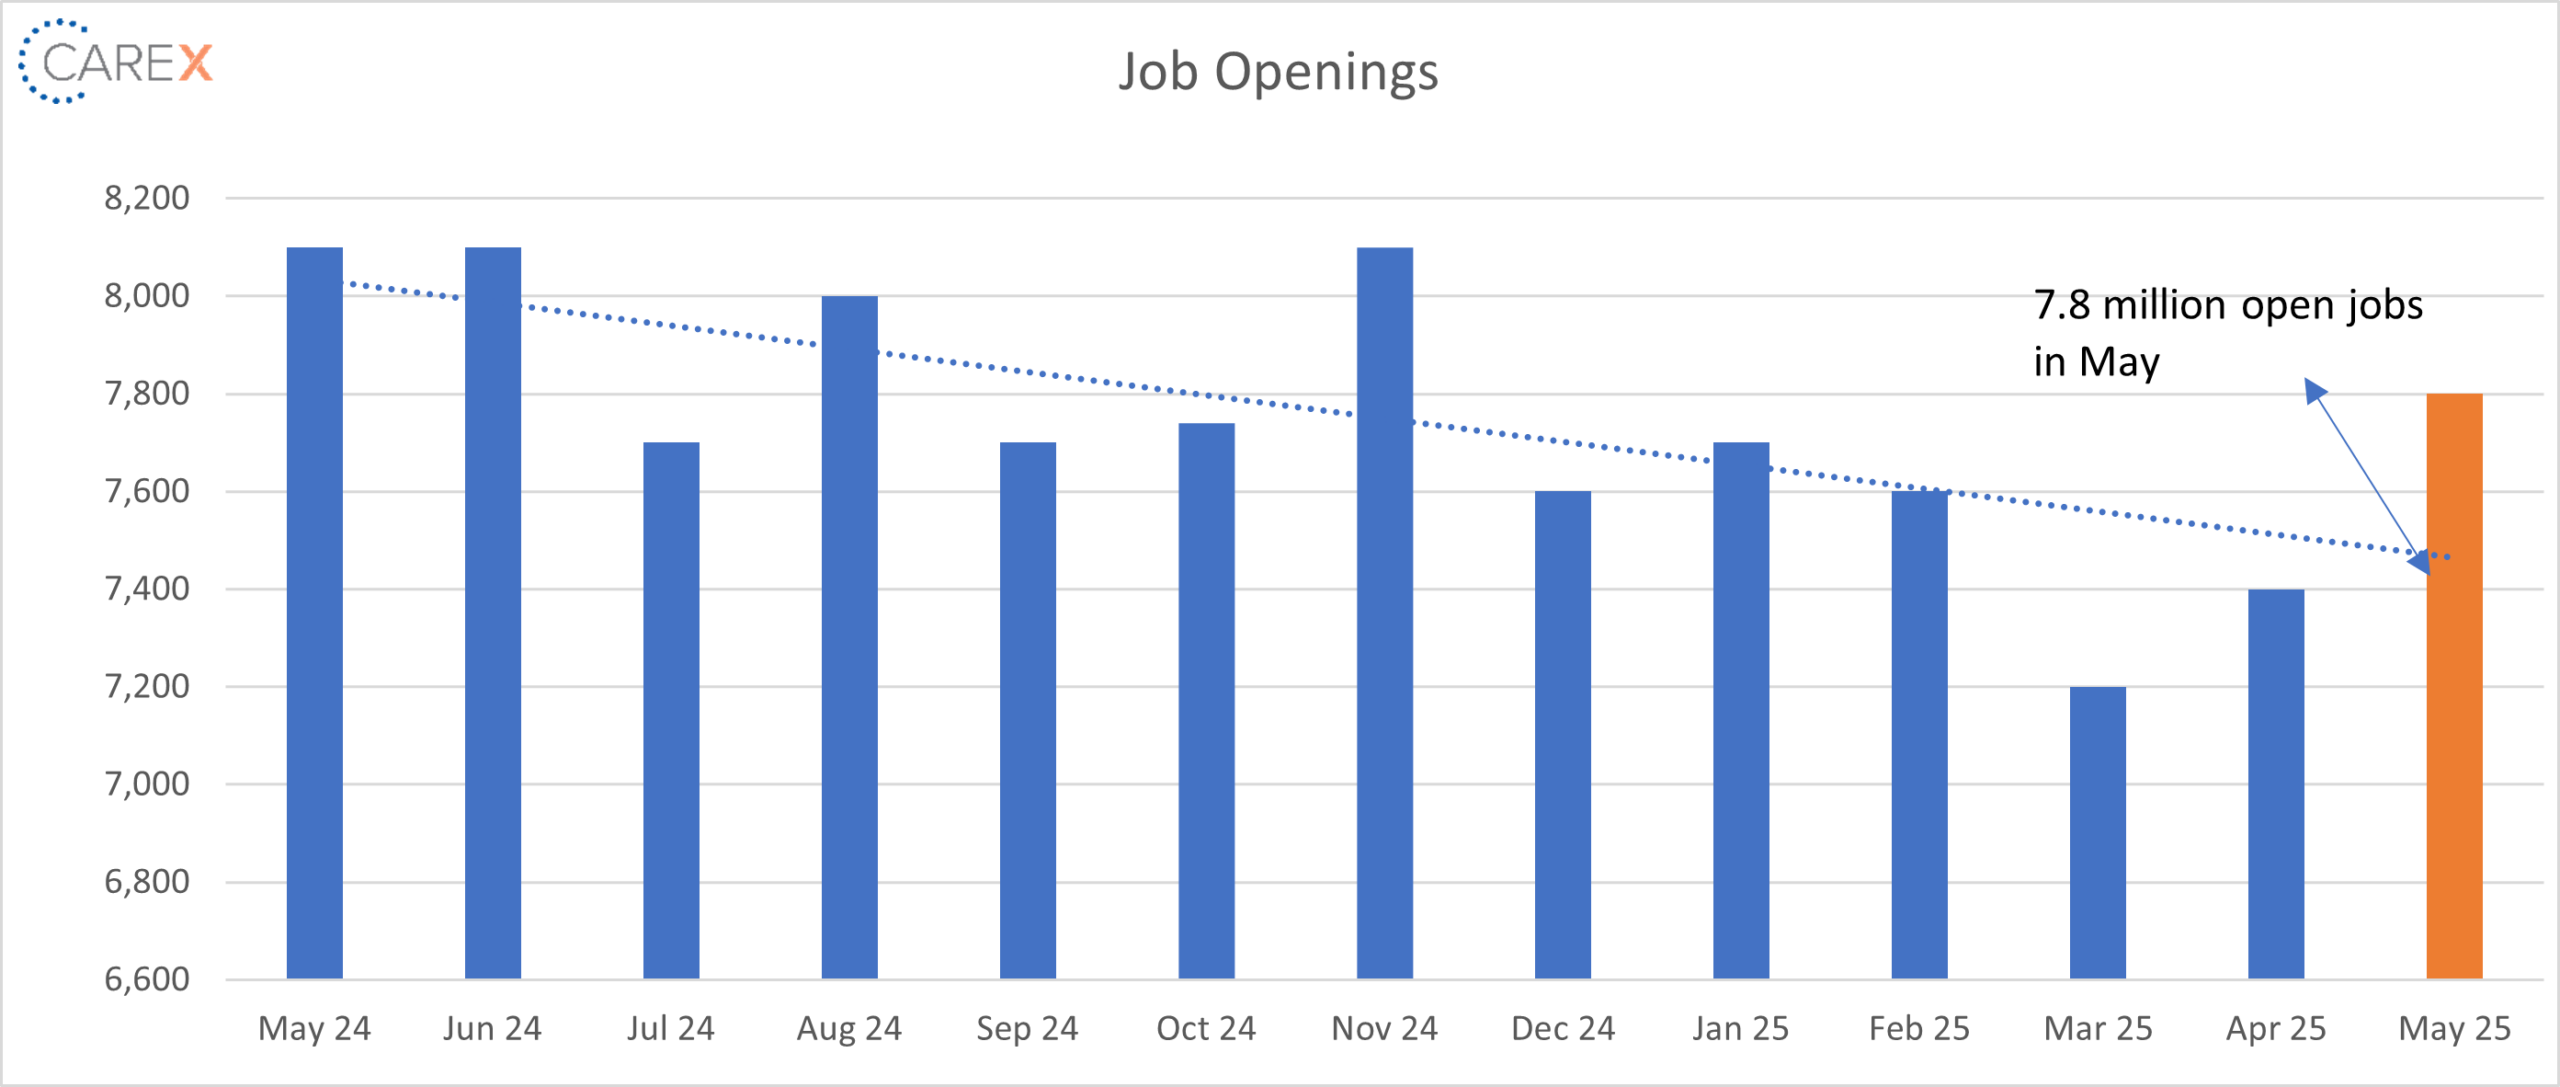
- Job openings increased to 7.8 million, up from 7.4 million the previous month
- The highest rate of 2025; however, it’s the 9th consecutive month job openings were below 8 million
- The number of job openings increased in accommodation and food services (+314,000) and in finance and insurance (+91,000); the number of job openings decreased in the federal government (-39,000)
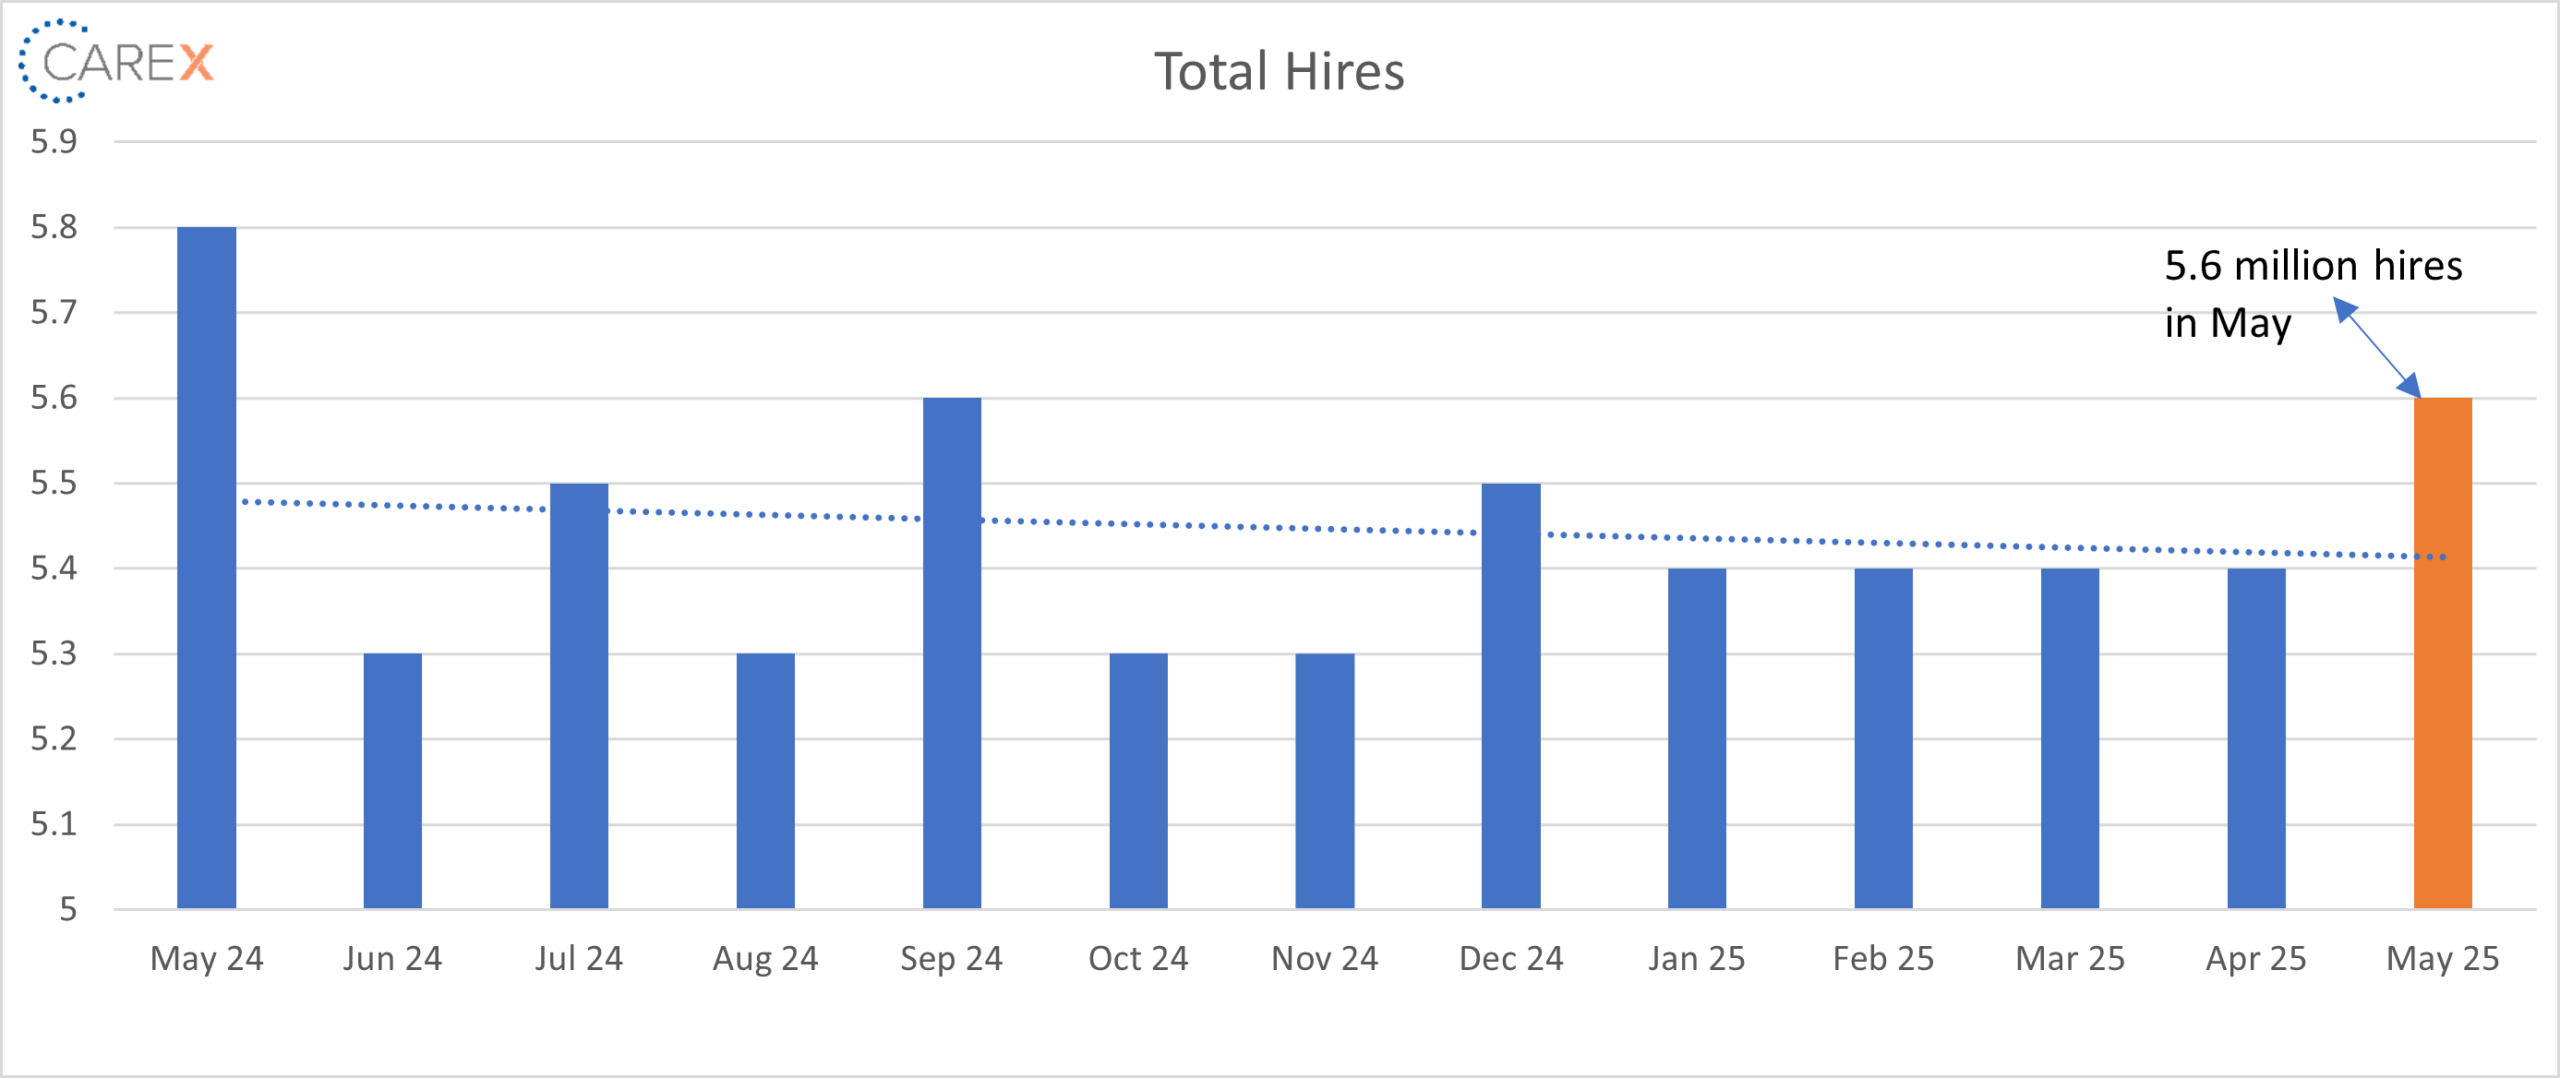
- Hires ticked up to 5.6 million, up from 5.4 million the previous month
- Not surprisingly, the number of hires decreased in the federal government (-11,000)
- The hiring rate remains stuck at levels last seen in 2014, when the U.S. economy was still emerging from the Great Recession
- Layoffs dropped to 1.6 million, down from 1.8 million the previous month
- The layoff rate remains very low by historical standards
- Quits increased slightly to 3.3 million, up from 3.2 million the previous month
- Quits, which are seen as a measure of worker confidence in the ability to change jobs and find another one continues to remain very steady – and very low
- The number of quits was little changed across all industries
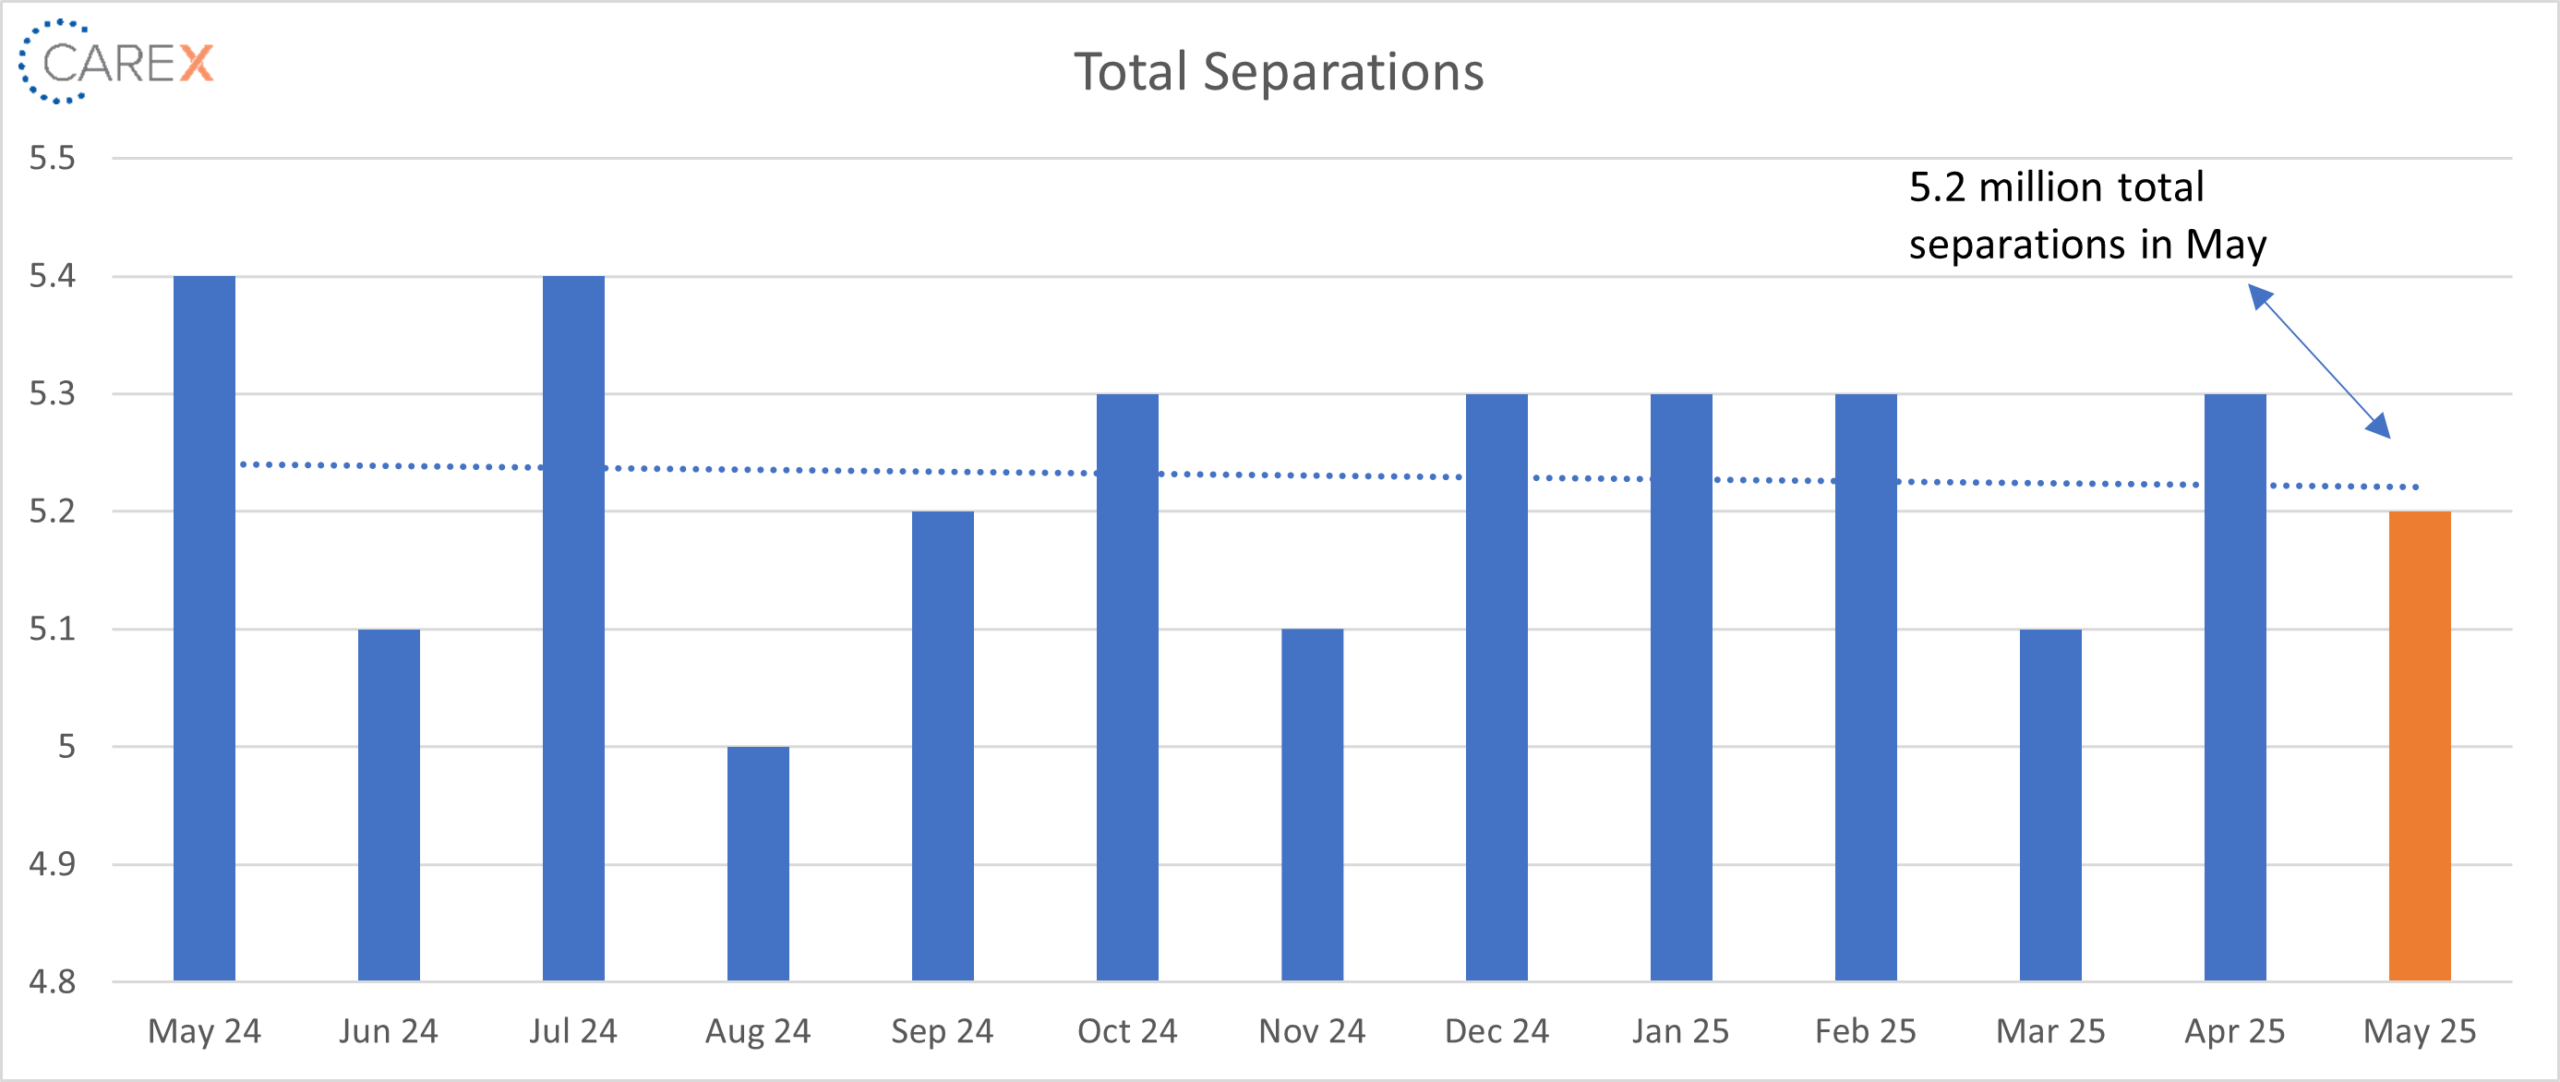
- Total separations dropped to 5.2 million, down from 5.3 million the previous month
- The total separations rate remained unchanged for the fifth month in a row at 3.3 percent
- Jobs per available worker remained steady 1.07:1
- At its peak in 2022, the ratio was 2:1
- LFPR (labor force participation rate) remained largely unchanged at 62.4%
- It hit a high of 67.3% in early 2000 and fell to 63.3% in the month before the onset of the pandemic

To make sure you never miss a Labor Market Insights update, you can subscribe to receive reminders via email! While you’re here, make sure to check out the other resources we have available.