

The BLS and JOLTS report was just released! Below is an overview of the key data points and our summary of the state of the labor market for June 2023.
Key Takeaways:
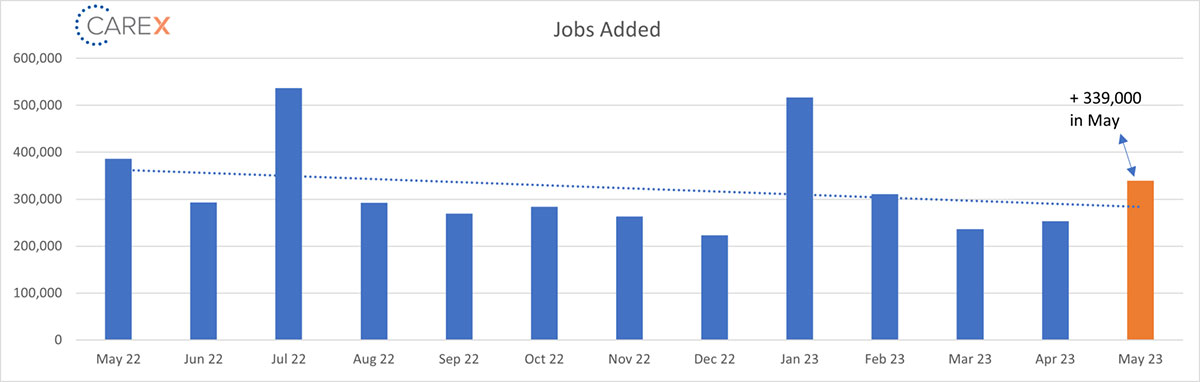
Hello summer—a season of ice cream, no school, cookouts, and interesting labor market data! If this month’s labor data was ice cream—it would be vanilla. Throw in the new jobs data, and we’d have vanilla ice cream with some rainbow sprinkles (jimmies for our East Coast friends). It’s delicious, but fairly ordinary and plain. Yes, we’re looking at some mixed signals in the BLS data, but, for me, the takeaway is the general balance we’re seeing. Jobs growth solidly beat expectations, coming in at 339,000 jobs added, but the unemployment rate jumped to 3.7% from the historically low 3.4%. The new job numbers are almost exactly in line with the 12-month average of 341,000.
Layoffs continue to grab headlines, but the layoff rate remains low both by historical and pre-pandemic levels. There is no notable acceleration in the layoff rate in any sector; however, there appears to have been a sizable deceleration in the layoff rate in the tech-heavy Information sector.
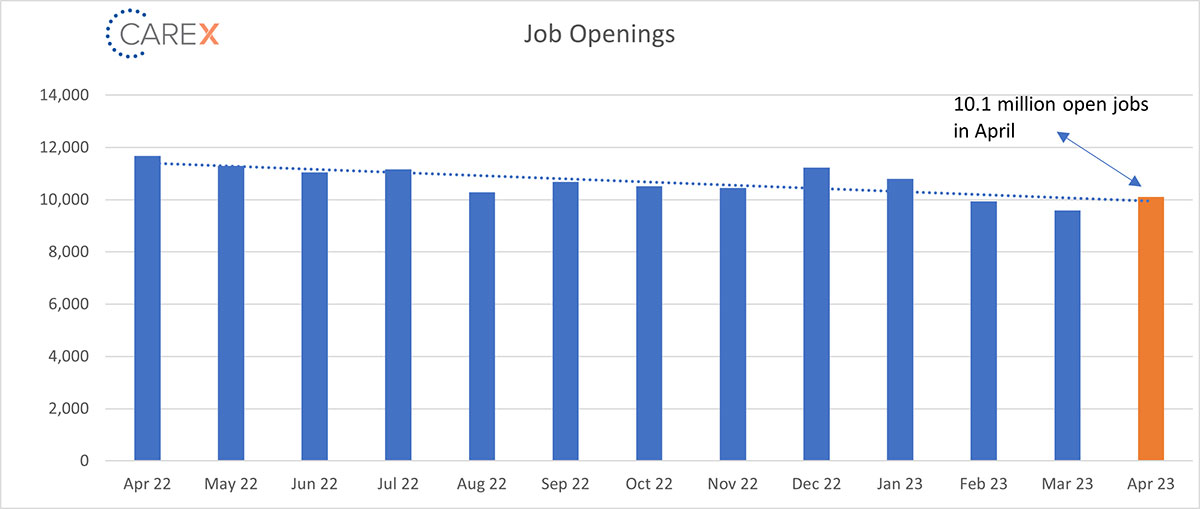
Many headlines will suggest that with job openings rising back above 10 million, employers still find it difficult to fill open positions. While that may be partly true, I continue to feel a percentage of jobs aren’t “real.” Some companies have open jobs as placeholders, with either no intention of hiring, or pipelining talent for the future. Additionally, according to Goldman Sachs economist Ronnie Walker, a low response rate to the BLS survey, which has reduced the sample size, could be boosting the JOLTS data, noting that some alternative measures of job openings from other sources, have declined sharply in the past year.
For those inclined, you can probably use this month’s data to fit your personal narrative. However, as usual, the truth likely comes out somewhere in the middle. For now, enjoy your vanilla ice cream with rainbow sprinkles/jimmies.
By the Numbers:
- New Jobs – The U.S. added 339,000 new jobs last month, an increase over last month’s addition of 253,000 new jobs (chart above).
- Significantly higher than what economists predicted (~190k).
- This marked the 29th straight month of positive job growth.
- Professional and business services led job creation for the month with 64,000 new hires.
- Unemployment rose to 3.7%, an increase from 3.4% the previous month.
- Economists were expecting unemployment to rise to only 3.5%.
- The 0.3% increase in the unemployment rate is the highest monthly increase since April 2020.
- The jobless rate was the highest since October 2022, though still near the lowest since 1969.
- Wages were up 0.3% on the month.
- Down from the previous month’s gain of 0.5%.
- On an annual basis, wages increased 4.3%, which was 0.1 percentage point below the estimate.
- Job openings increased 358,000 to 10.1 million, a surprising increase from 9.59 the previous month (chart above).
- The increase in job vacancies was led by retail trade, where there were an additional 209,000 openings.
- Businesses with one to nine employees and those with 250 to 999 workers accounted for last month’s rise in job vacancies (companies with 10 to 49 workers reported a sharp drop).
- Job openings surged in the West and Midwest, rose moderately in the South, but fell in the Northeast.
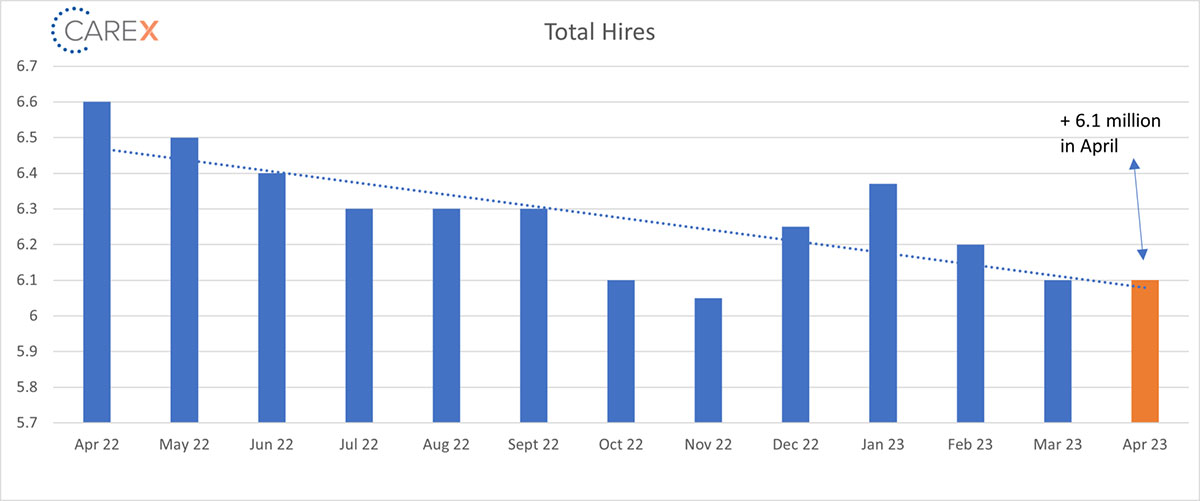
- Hires remain largely unchanged at 6.1 million, with a slight drop from 6.2 million two months ago (chart above).
- Hires continue to fall at a slow but steady pace—the rate was 6.3 million three months ago.
- It’s likely this number will continue to edge down as job openings and new jobs created start to normalize.
- Layoffs dropped 264,000 to 1.6 million, a notable reversal from last month’s increase of 248,000 layoffs.
- Layoffs decreased by 113,000 in construction, another sector hard hit by the Fed’s rate hikes.
- Quits – The number of people quitting their job remained largely unchanged at 3.8 million, a slight decrease from 4 million two months ago.
- Despite the strong demand for labor, workers are growing less confident, leading to fewer resignations.
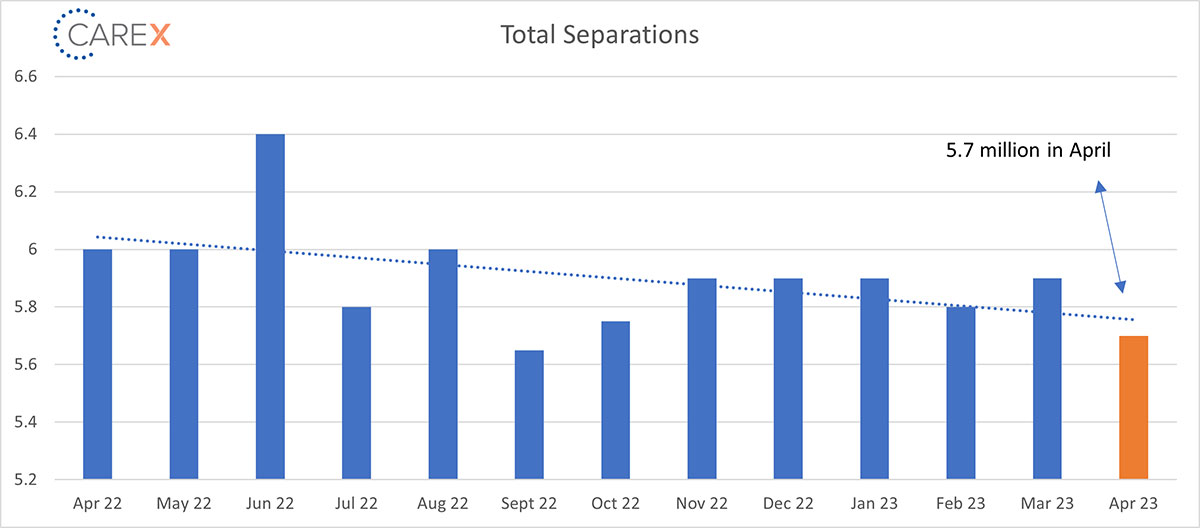
- Total separations decreased to 5.7 million, a slight drop from 5.9 million (chart above).
- Notable: separations in the Technology sector dropped by 33,000—a positive sign that the Technology Sector is stabilizing.
- Jobs per available worker increased to 1.8:1, up from 1.7:1 the previous month.
- Three months ago, the ratio was 1.9:1 (and averaged ~2:1 over the past 2-years).
- This is a definitive sign that the labor market continues to cool, which will likely keep wages low and start to curb voluntary quits.
- Pre-pandemic this number was ~1.2:1.
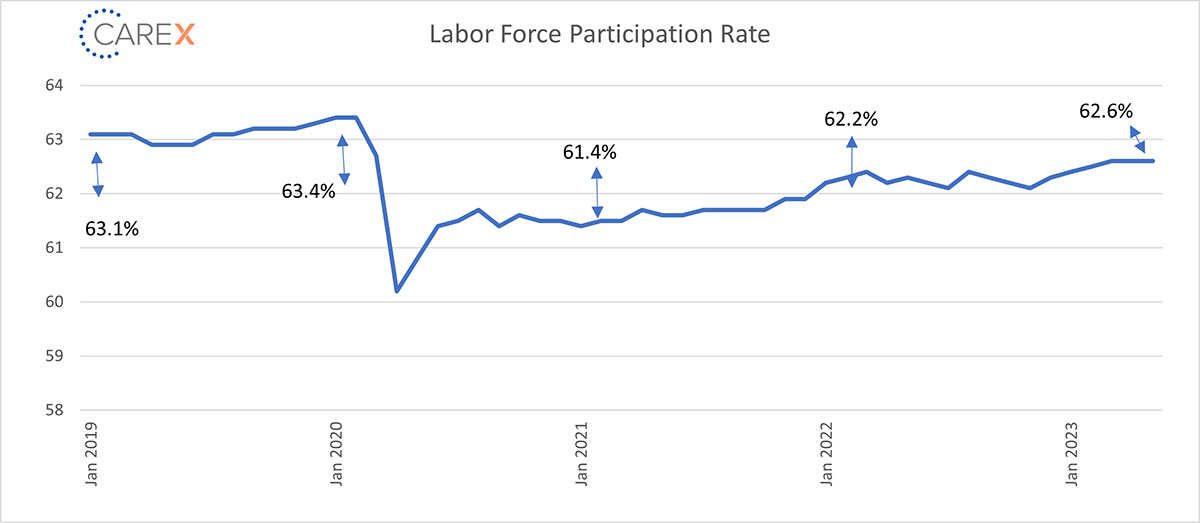
- Labor force participation rate (LFPR) held steady at 62.6%.
- The highest since the pandemic started in early 2020 but still leaves it well below the pre-COVID level of 63.4%.
- The prime-working-age labor force participation rate moved up to 83.4%, matching its highest level since 2002.
To make sure you never miss a Labor Market Insights update, you can subscribe to receive these updates via email here! And while you’re here, make sure to check out the other resources we have available.