The BLS and JOLTS report was just released! Below is an overview of the key data points and our summary of the state of the labor market for March 2023.
Key Takeaways:
- Job gains are fluctuating month-to-month, but the average monthly job gains of 351,000 over the last three months is not much lower than the 400,000 seen over 2022 as a whole.
- The quit rate (an important data point signifying worker confidence in the labor market) fell but is still elevated. Many workers are now able to work for a wider variety of employers as they can work remotely. The wider competition for workers may permanently increase employee quit rates.
- Layoffs increased ~16%. Historically, that’s an average figure, but it’s the highest in more than two years and raises questions about whether the U.S. is heading toward a recession this year (as many economists predict). Not surprisingly, the tech sector continues to bear the brunt of layoffs.
- It’s highly likely that recent tech layoffs will spur a wave of start-ups. Early indicators suggest a surge of new tech companies are emerging, being led by the very individuals that have had their job impacted over the last few months.
- While the jobs gains are a positive sign, job postings have declined, lots of large companies have announced layoffs, and workers who lose a job are taking longer to find a new one.
- Even with the cooling data, Fed Chairman Jerome Powell called the jobs market “extremely tight” and cautioned that a recent spate of data showing resurgent inflation pressures could push interest rate hikes higher than expected.
- The JOLTS data is an important indicator of the labor market; however, it’s also important to consider other non-government data. For example, private sector data (LinkedIn, Indeed, etc.) have shown a considerable stronger decline in key labor market indicators (job postings, etc.). The takeaway: while the BLS data suggests a cooling of the market (but still strong), the actual temperature may be a few degrees cooler than the data suggests.
Why We Watch LFPR:
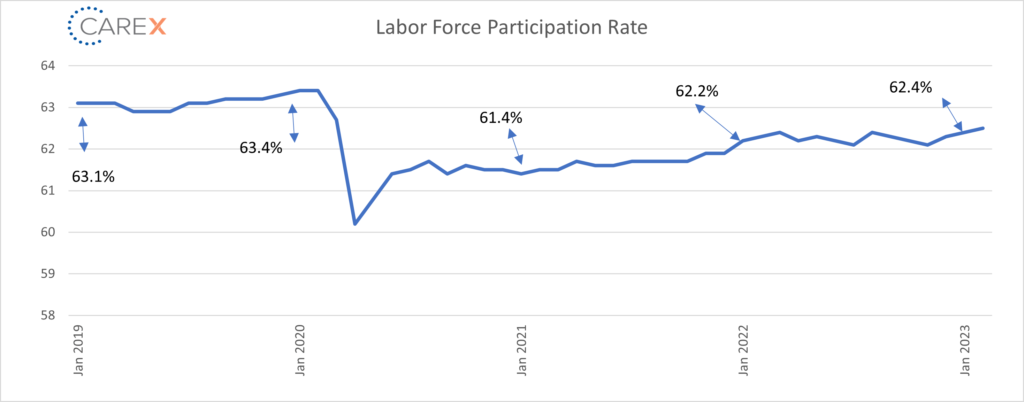
If you read these insights on a regular basis, you’ll note our emphasis on the Labor Force Participation Rate (LFPR)—this month is no exception. The BLS reported a LFPR increase, the highest it’s been since the pandemic (from 62.4% to 62.5%). While this may be reason for short-term optimism, it’s important to consider the long-term impact of the LFPR. You won’t see this listed in a graph or in the recent JOLTS report, but for the first time in history, the U.S. working age population (16-64) is no longer growing.
While the LFPR increased this month, the LFPR has generally stalled and will likely dip over time. So, as we continue to add jobs at historic rates (albeit inconsistently), where are the employees going to come from? The working age population is not growing. Immigration isn’t likely to play a factor given the current political climate. Other trends impacting the LFPR show concerning signs (marriage rate, mental health deterioration, decline in education, etc.).
The LFPR reinforces the importance of companies thinking creatively when addressing long-term recruiting and retention strategies. Now, onto the data…
By the numbers:
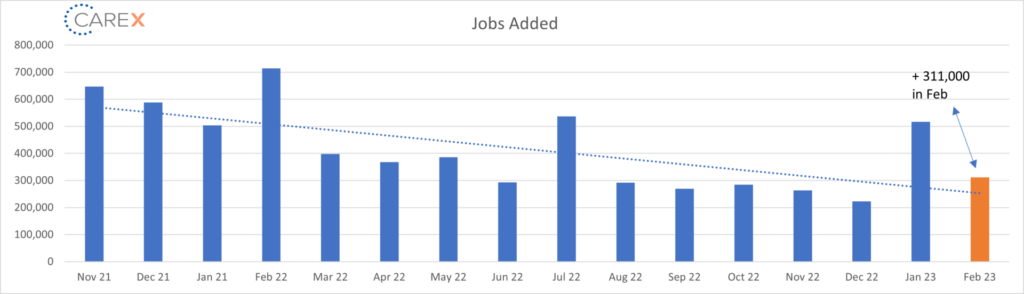
- New Jobs– The U.S. added 311,000 jobs last month, a sharp decline from the previous month’s gains of 517,000 new jobs (chart above).
- While lower than last month, the gains outpaced economists’ expectations of 225,000 new jobs.
- Half of the new jobs created last month were at service-side companies such as retailers (50,000), restaurants (70,000) and hotels (14,000)—businesses whose employment still has not returned to pre-pandemic peaks.
- Government (46,000), white-collar professional businesses (45,000), health-care providers (44,000), and construction companies (24,000) accounted for the rest of the increase.
- Unemployment rose to 3.6%, up from 3.4% the previous month.
- Economists estimated a rate of 3.4%.
- Wages increased just 0.2%, the smallest increased in a year.
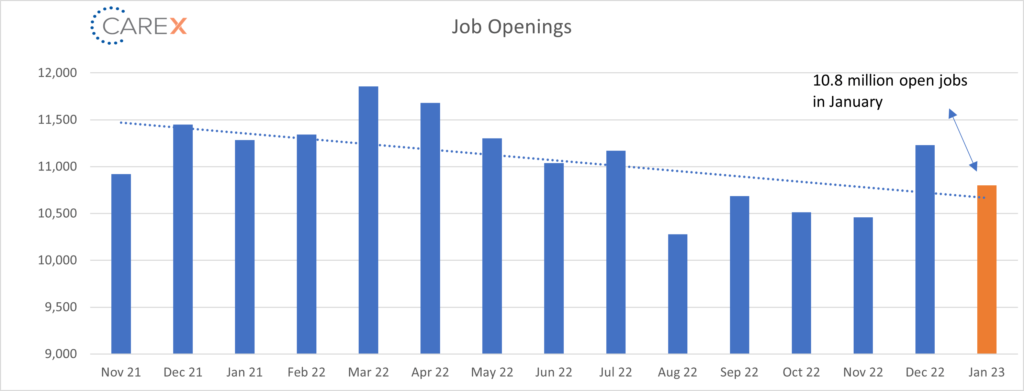
- Job openings decreased to 10.8 million, down from 11.23 million the previous month (chart above).
- While there have been at least 10 million job openings for 20 consecutive months, there is a notable declining trend line.
- The number of openings once again exceeded economists’ estimates which projected only 10.5 million openings.
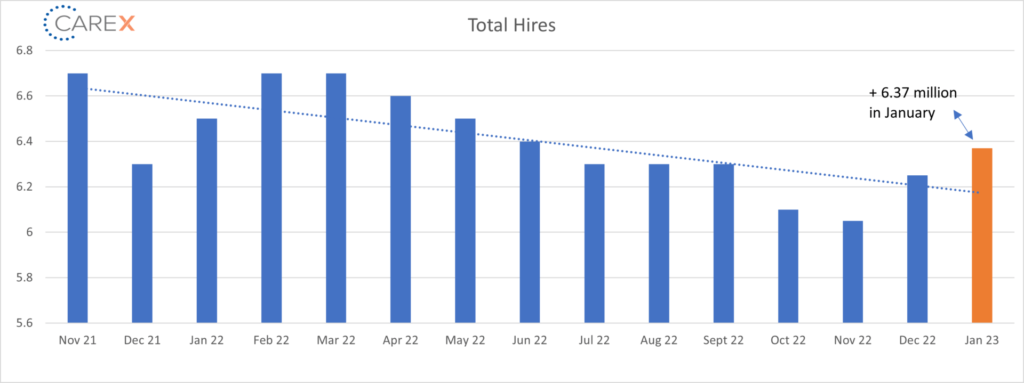
- Hires increased to 6.37 million from 6.25 million the previous month (chart above).
- This is the highest level since last July.
- Layoffs surged to 1.72 million, up from 1.48 million the previous month.
- The steady increase of layoffs suggests that the period of unprecedented job security may be coming to a close.
- The estimated 1.72 million layoffs in January marks a noticeable turnaround from trends of two years when the monthly levels averaged 1.44 million and did not get above 1.63 million.
- Quits – The number of people quitting their job fell to 3.89 million, down from 4.09 million the previous month (chart above).
- This is significant, as this is the first time the quit rate fell below 4 million after 19 straight months (it was 3.4 million before the pandemic and averaging 2.6 million in the prior years).
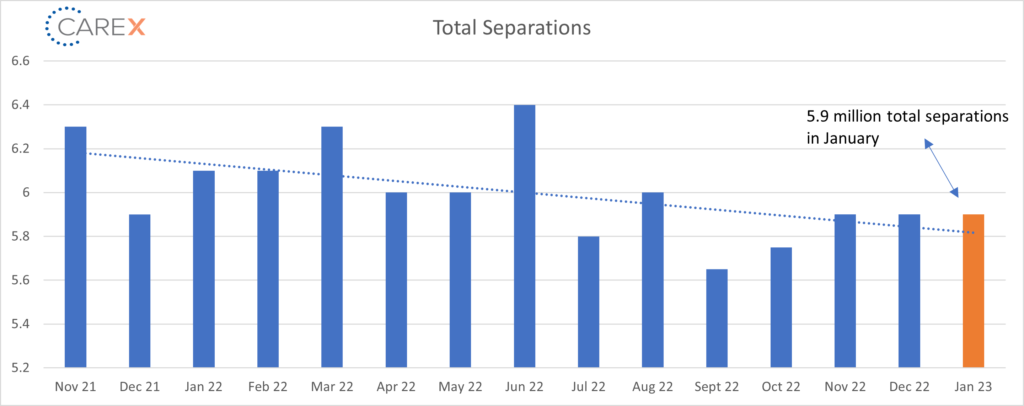
- Total separations remain unchanged for two months in a row at 5.9 million (chart above).
- Initial jobless claims, another gauge of layoffs, have remained low, but that may not capture the full picture if workers receiving severance packages haven’t yet filed for unemployment insurance.
- Separations decreased in professional and business services (-29,000), finance and insurance (-20,000), and health care and social assistance (-18,000). The number of other separations increased in accommodation and food services (+15,000); information (+11,000); and arts, entertainment, and recreation (+4,000).
- Jobs per available worker remained unchanged at 1.9:1.
- This equals a gap of ~5.13 million.
- Once again, this is not what the Federal Reserve has been hoping for as it seeks to quell inflation.
- Pre-pandemic this number was ~1.2:1.
- Labor Force Participation Rate (LFPR) – The LFPR edged a bit higher to 62.5%.
- From the Fed’s perspective, this is good news on the participation front, which helped push unemployment up.
- This is the third straight increase and the highest level since early in the pandemic in 2020.
To make sure you never miss a Labor Market Insights update, you can subscribe to receive these updates via email here! And while you’re here, make sure to check out the other resources we have available.