
Now, here’s our labor market insights for March 2026, written by Matt Duffy:
A few months ago, I received feedback that my labor market insight reports were too negative. So last month, I tried to explain why optimism about the labor market isn’t simply wishful thinking. Guess what? I received feedback on that too, this time that I was expressing “blind optimism.” At this point, I feel a bit like the Milwaukee Bucks…I just can’t win.
So, this month, I’ll skip any narrative that could be interpreted as either pessimistic or optimistic and focus purely on the numbers.
Specifically, I want to examine the elusive job creation figure. It’s typically the most celebrated data point in each labor report and is often used by politicians and armchair economists alike to support (or criticize) whatever agenda they may have. But like many headline numbers, when job creation figures are released, we rarely stop to ask an important question – “So what?”
We all understand that negative job growth is a bad sign. But what about positive job growth? What number actually indicates meaningful expansion in the labor market?
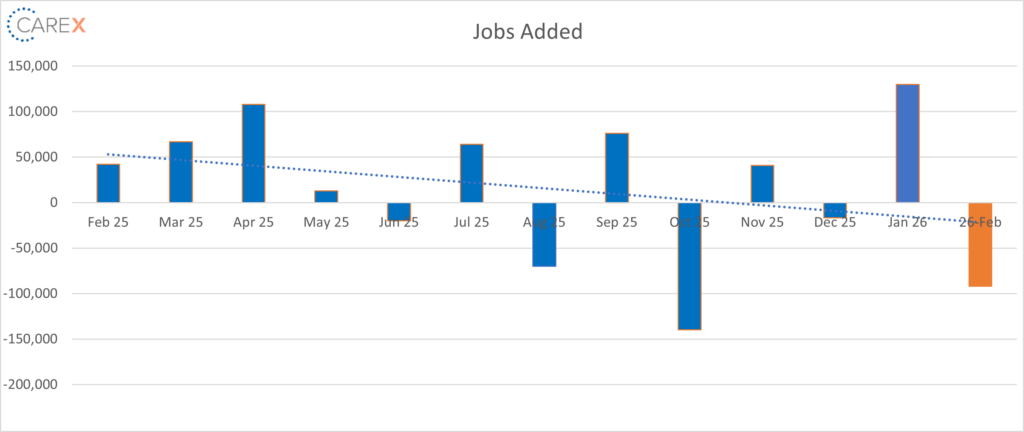
For example, in January 2026 the U.S. added 130,000 jobs. In November, it added 41,000, and in May, just 13,000. Without context, these numbers are difficult to interpret because a critical reference point is often missing – the threshold that represents true labor market growth.
Simply adding jobs does not necessarily mean the labor market is expanding. Other factors must be considered, including unemployment, labor force participation, the layoff rate, etc.
This is where the concept of breakeven job growth becomes important. Breakeven job growth refers to the number of jobs the economy must add each month to keep the unemployment rate stable (currently 4.4%).
Recent updates to population and labor force models suggest a structural shift: the U.S. workforce is aging, and labor force growth is slowing compared with prior decades. As a result, the breakeven threshold has declined significantly. From 2021–2024, the economy needed ~175,000 new jobs per month to maintain a stable unemployment rate. Current estimates suggest that number may now be closer to 30,000 per month.
This shift has important implications. While negative payroll numbers remain concerning, the baseline for sustainable job growth has structurally declined. In other words, expectations around what constitutes “healthy” job growth may need to adjust (potentially for years to come).
For a more detailed breakdown of the latest labor market data, see the “By the Numbers” section below.
By the Numbers:
- New Jobs – The U.S. lost 92,000 jobs in February
- Healthcare shed 28,000 jobs; the first time this sector lost jobs since January 2022
- Information services lost 11,000 jobs; a 12-month trend in which the sector has lost an average of 5,000 per month
- Manufacturing saw a loss of 12,000, despite tariffs aimed at reshoring jobs from overseas
- Unemployment rose to 4.4%, up from 4.3% the previous month
- Long-term unemployment also surged higher, with the average duration of unemployment at 25.7 weeks, the longest since December 2021.
- Job openings increased slightly to 6.9 million, up from 6.5 million the previous month
- Notably, job openings increased in finance and insurance (+184,000)
- Declines in job openings have been especially severe in a few sectors over the past couple of months, including financial activities (~25%) and professional & business services (~22%)
- In 2025, the annual average job openings level was 7.1 million, a decrease of 571,000 from 2024
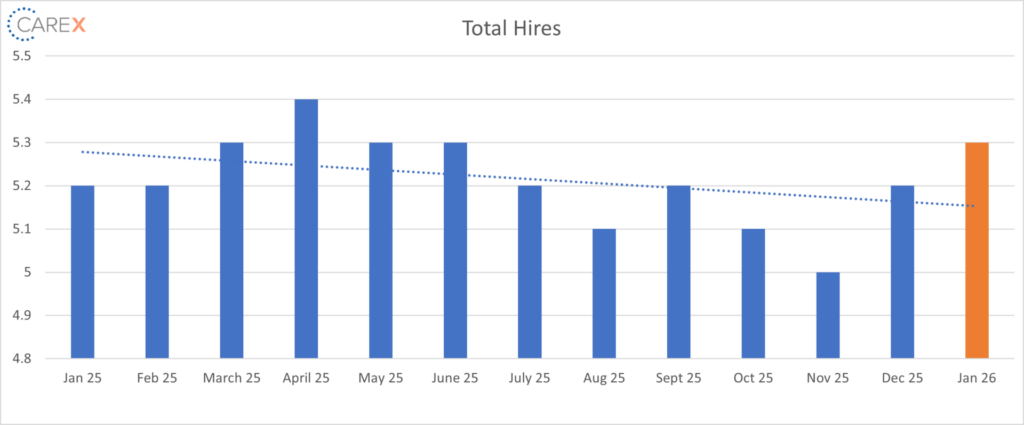
- Hires remained unchanged at 5.3 million
- A notable decrease in hires occurred in transportation, warehousing, and utilities (-67,000)
- The hiring rate continues to remain stuck at levels last seen in 2013, when the U.S. economy was still emerging from the Great Recession
- Layoffs dropped to 1.6 million, down from 1.8 million the previous month
-
- The layoff rate has dropped back to 1.1%, the same rate as the fall of 2025
- Quits dropped to 3.1 million, down from 3.2 million the previous month
- Quits, which are seen as a measure of worker confidence in the ability to change jobs and find another one continues to remain very low
- Total separations dropped slightly to 5.1 million, down from 5.3 million the previous month
- The number of total separations decreased in transportation, warehousing, and utilities(-79,000)
- Jobs per available worker remained steady at 0.87:1
- At its peak in 2022, the ratio was 2:1

To make sure you never miss a Labor Market Insights update, you can subscribe to receive reminders via email! While you’re here, make sure to check out the other resources we have available.