
The BLS and JOLTS report was just released! Below is an overview of the key data points and our summary of the state of the labor market for May 2023.
Key Takeaways:
Making sense of the labor market is difficult. This month’s data is darn right puzzling. Today, as I was reading the new jobs report headlines (we added 253k new jobs!), I found myself wanting to believe the hype—the market is “heating up” (as many headlines suggest). Maybe it’s because I’m still sour that Rodgers left the Packers, or that the Bucks fizzled out in the first round of the playoffs, but I’m taking a bit more pragmatic (pessimistic?) view of the labor market. Admittedly, I sound like my grandfather yelling at kids to get off his lawn when I write this…but here we go.
Let’s start with the three signs that we’re all excited about:
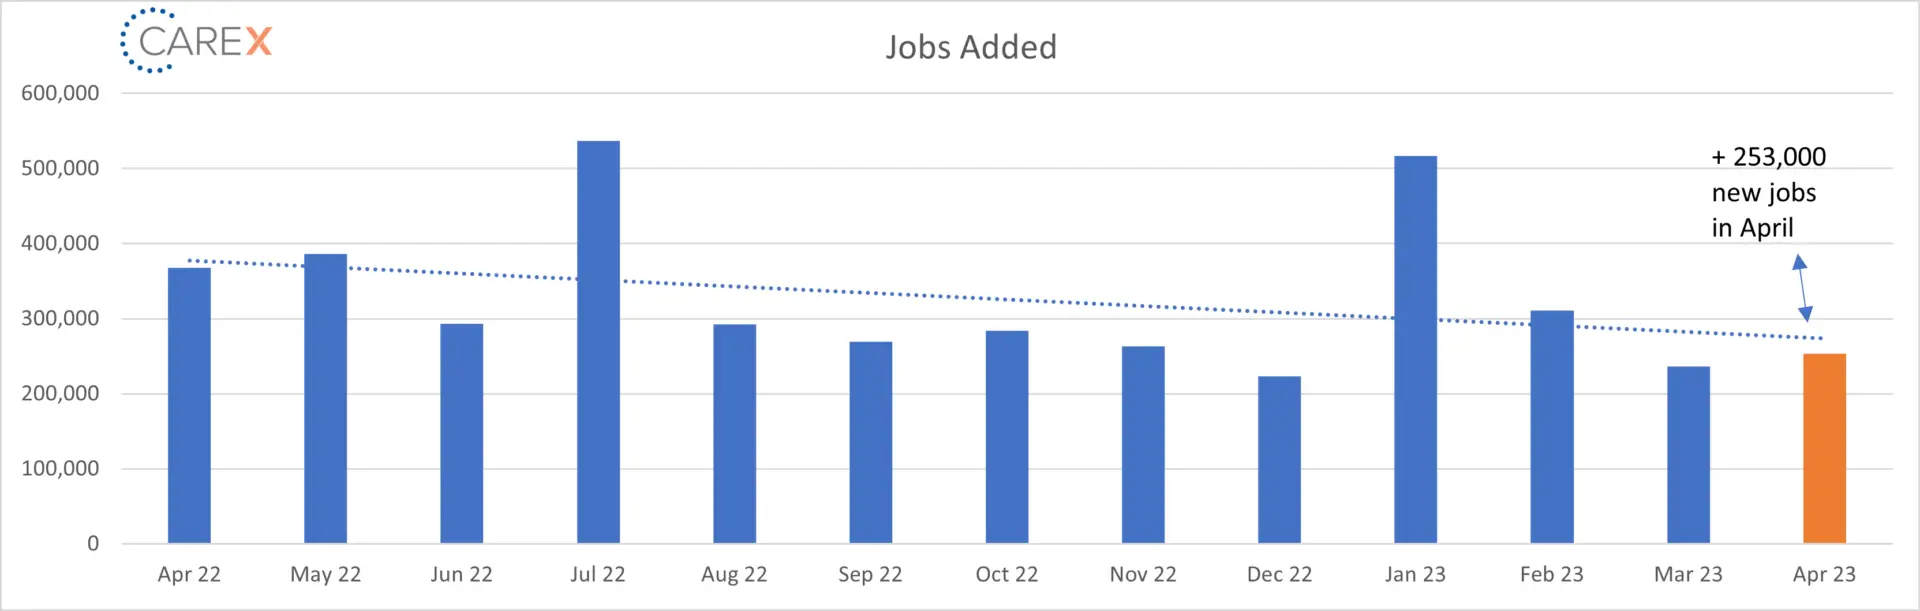
- The US added 253,000 new jobs this month (an increase over last month and more than the economists predicted)!
- But…if we zoom out and look at the data from December 2021, we see a concerning trend line—new job creation is declining from our post-pandemic highs. If you want a headline, 1-month snippets are good; if you want a story, we need to zoom out.
- Unemployment dropped to a historic low of 3.4% (a drop from last month and lower than what economists predicted)!
- But…job openings are dropping, hires are dropping, and separations are increasing. Logically, I think unemployment will increase over the next several months.
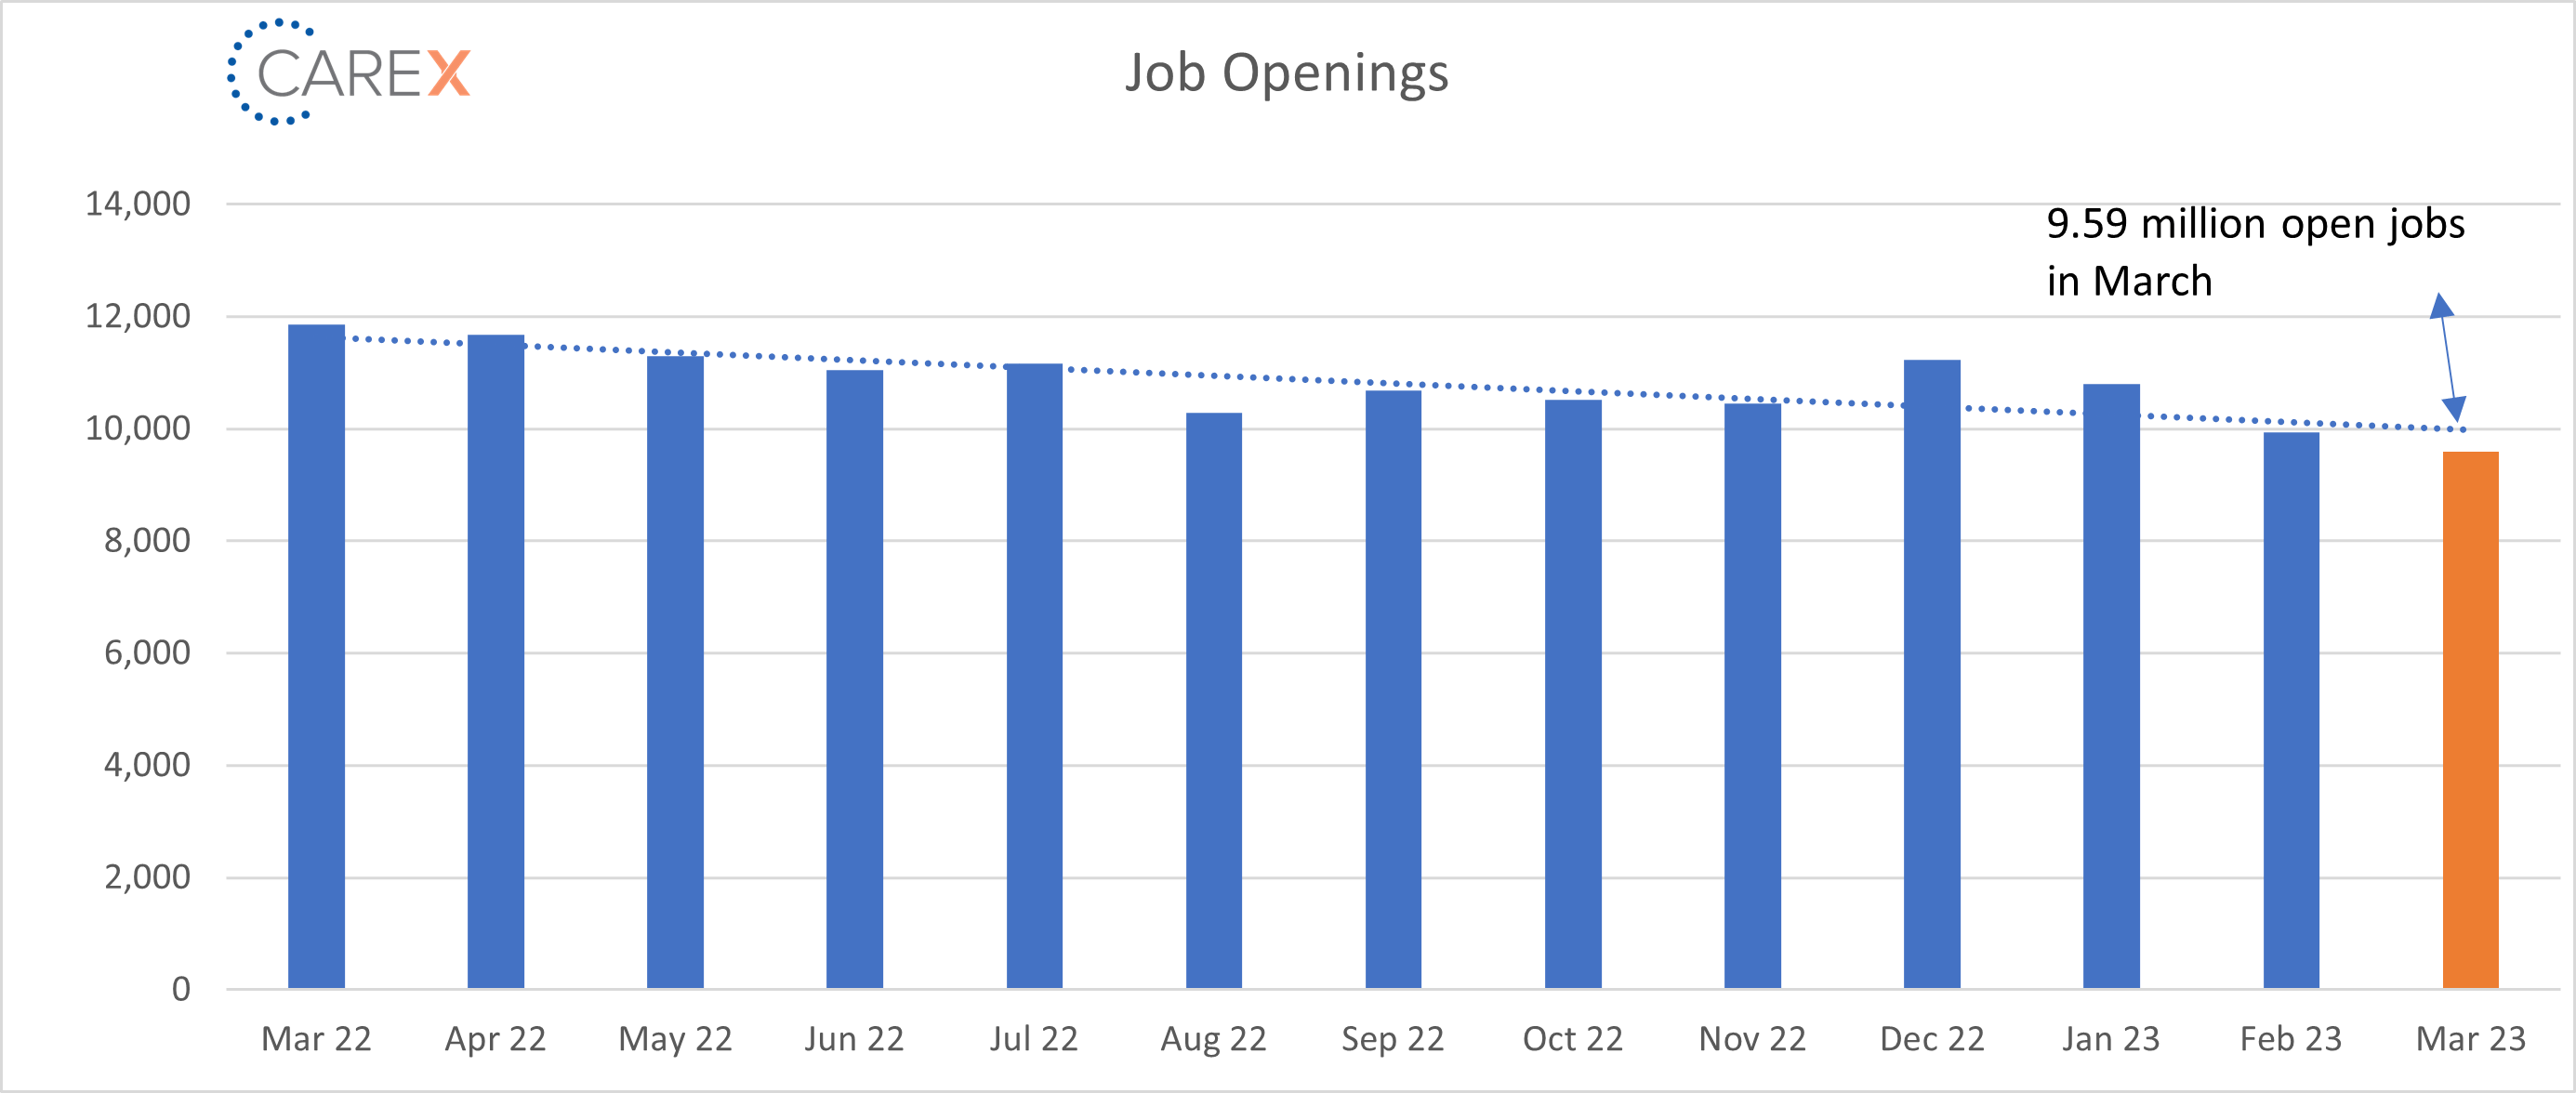
- There are 9.5 million open jobs in the US (more jobs than people looking for work)!
- But…job openings fell for the third straight month, and the decline has been concentrated in small-mid sized business, which have been the main drivers of the labor market’s recent phenomenal growth.
Some additional thoughts:
- The more persuasive signs of cooling are coming from rising layoffs—both the level of layoffs and the layoff rate in March 2023 are higher than any month since December 2020.
- How many times have you heard the comment (mostly at a restaurant or retail store) “There are so many open jobs, people just don’t want to work anymore!”? Based on the prime-age labor force participation rate data, we know that’s not entirely true. The prime-age LFPR rate hit 83.3% in April, the highest level since 2008. The truth is, Americans by and large are working, and they are looking for work.
- The labor market is not cold—it’s simply cooling. We’ve shifted from wearing a t-shirt to a light long sleeve shirt. We’re not quite at sweater weather, but the next few months will dictate our wardrobe through the rest of 2023.
By the numbers:
- New Jobs – The U.S. added 253,000 new jobs last month, an increase over last month’s addition of 236,000 new jobs (chart above).
- The largest job gains were in private education, health services, professional and business services, and leisure and hospitality.
- It’s a surprising increase during a time when many indicators were pointing to a slowdown in the job market.
- Unemployment eased to 3.4%, down from 3.5% the previous month.
- Economists were expecting unemployment to rise to ~3.6%.
- Wages were up 0.5% on the month.
- This is a 4.4% gain over the past year.
- Job openings dropped another 384,000 to 9.59 million, a drop from 9.93 million the previous month (chart above).
- Below economists’ estimate of 9.64 million.
- Professional and business services job openings declined by 135,000.
- Vacancies fell in all four regions, with steep declines in the Midwest and West.
- After nearly two years of being above the 10 million mark, I would be surprised if we eclipsed that mark again in 2023.
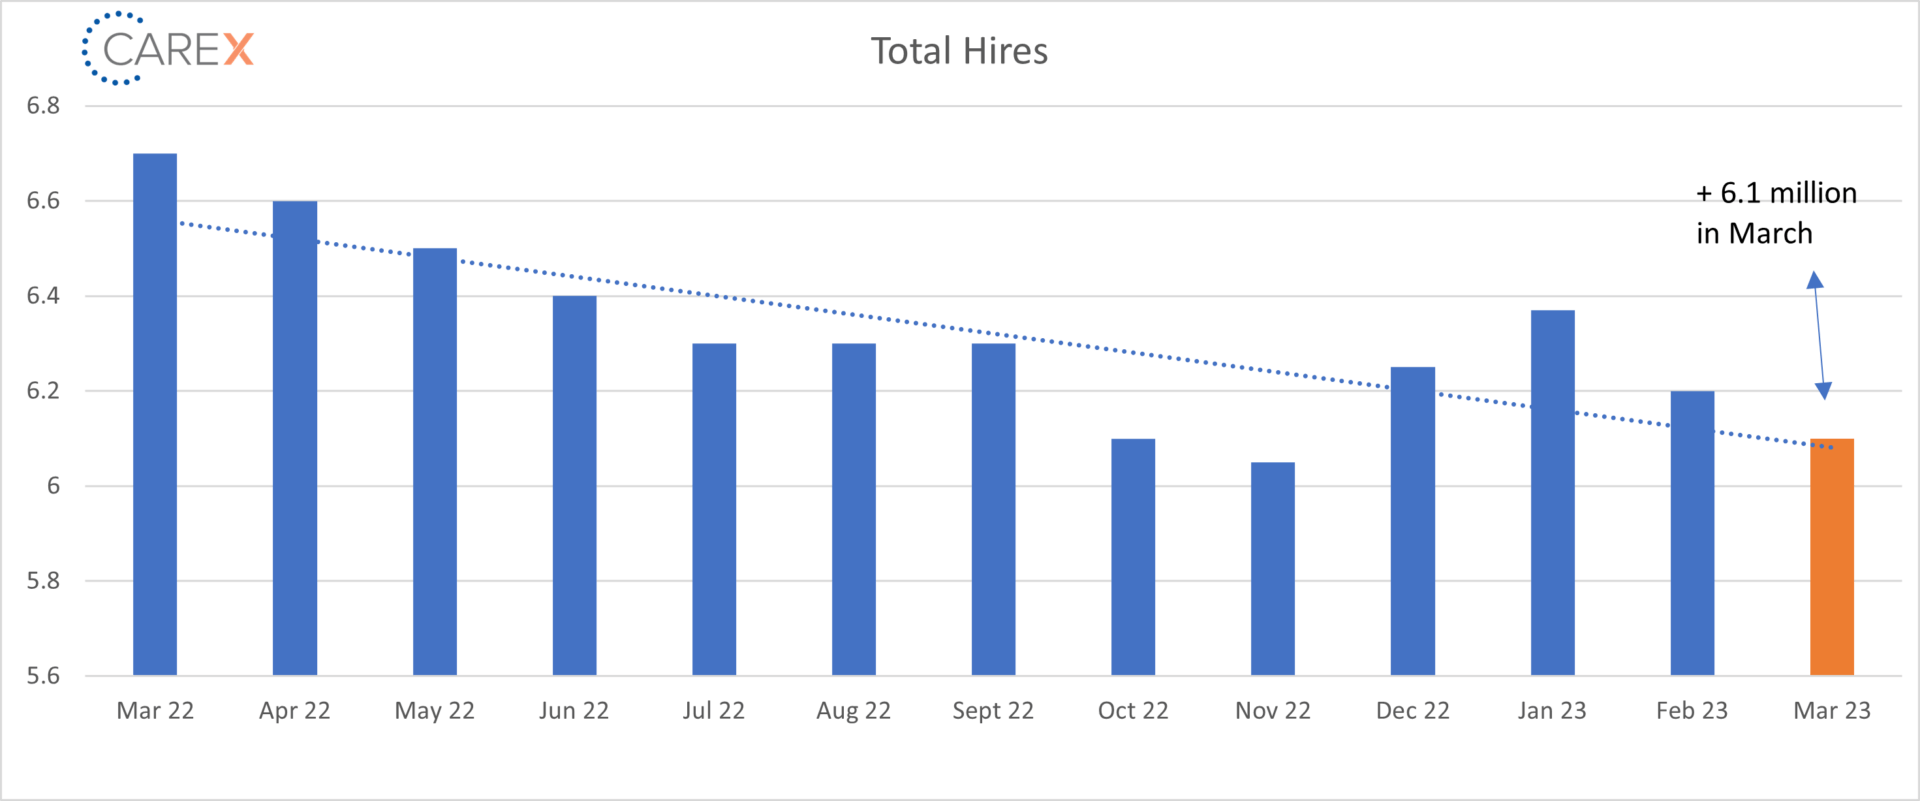
- Hires fell slightly to 6.15 million, a drop from 6.2 million the previous month (chart above).
- Hires continue to fall at a slow but steady pace—the rate was 6.3 million two months ago.
- It’s likely this number will continue to edge down as job openings and new jobs created start to normalize.
- Layoffs increased 248,000 to 1.8 million, up from 1.5 million the previous month.
- The increase was led by the construction industry, which shed 112,000 positions.
- Professional and business services layoffs increased by 49,000.
- The steady rate of layoffs suggests that the period of unprecedented job security may be coming to a close.
- Quits – The number of people quitting their job declined by 129,000 to 3.85 million, down from 4 million the previous month.
- The lowest level since May 2021 amid what had been dubbed the “Great Resignation.”
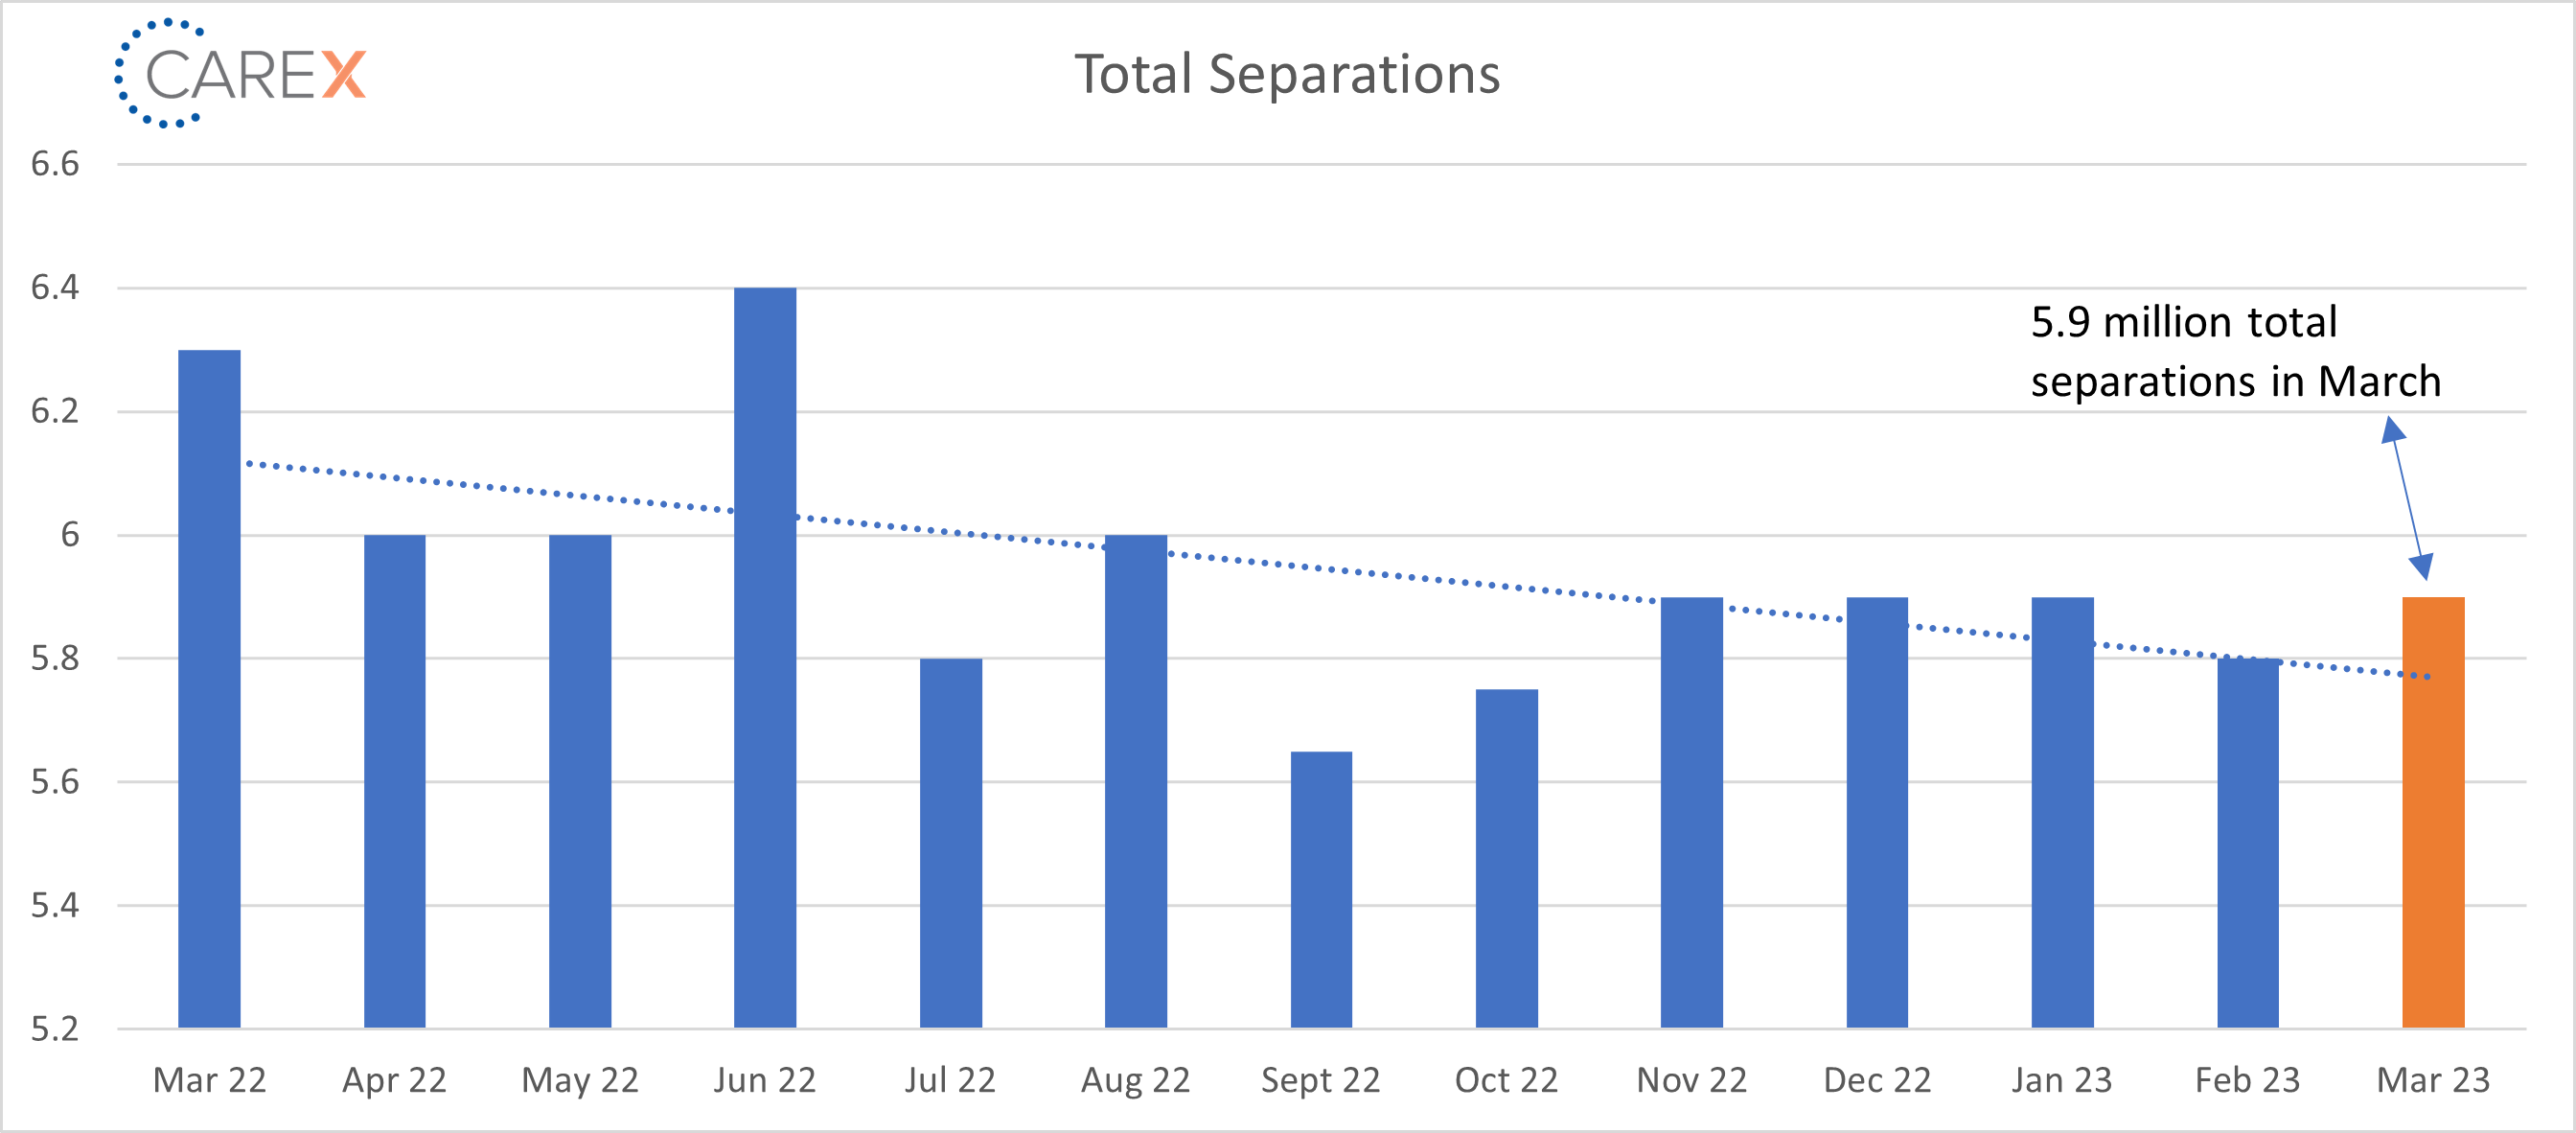
- Total separations rose slightly to 5.9 million, up from 5.8 million the previous month (chart above).
- Initial jobless claims, another gauge of layoffs, have remained low, but that may not capture the full picture if workers receiving severance packages haven’t yet filed for unemployment insurance.
- Jobs per available worker dropped to 1.6:1, down from 1.7:1 the previous month.
- Just two months ago the ratio was 1.9:1 (and averaged ~2:1 over the past 2 years).
- A definitive sign that the labor market continues to cool, which will likely keep wages low and start to curb voluntary quits.
- Pre-pandemic this number was ~1.2:1.
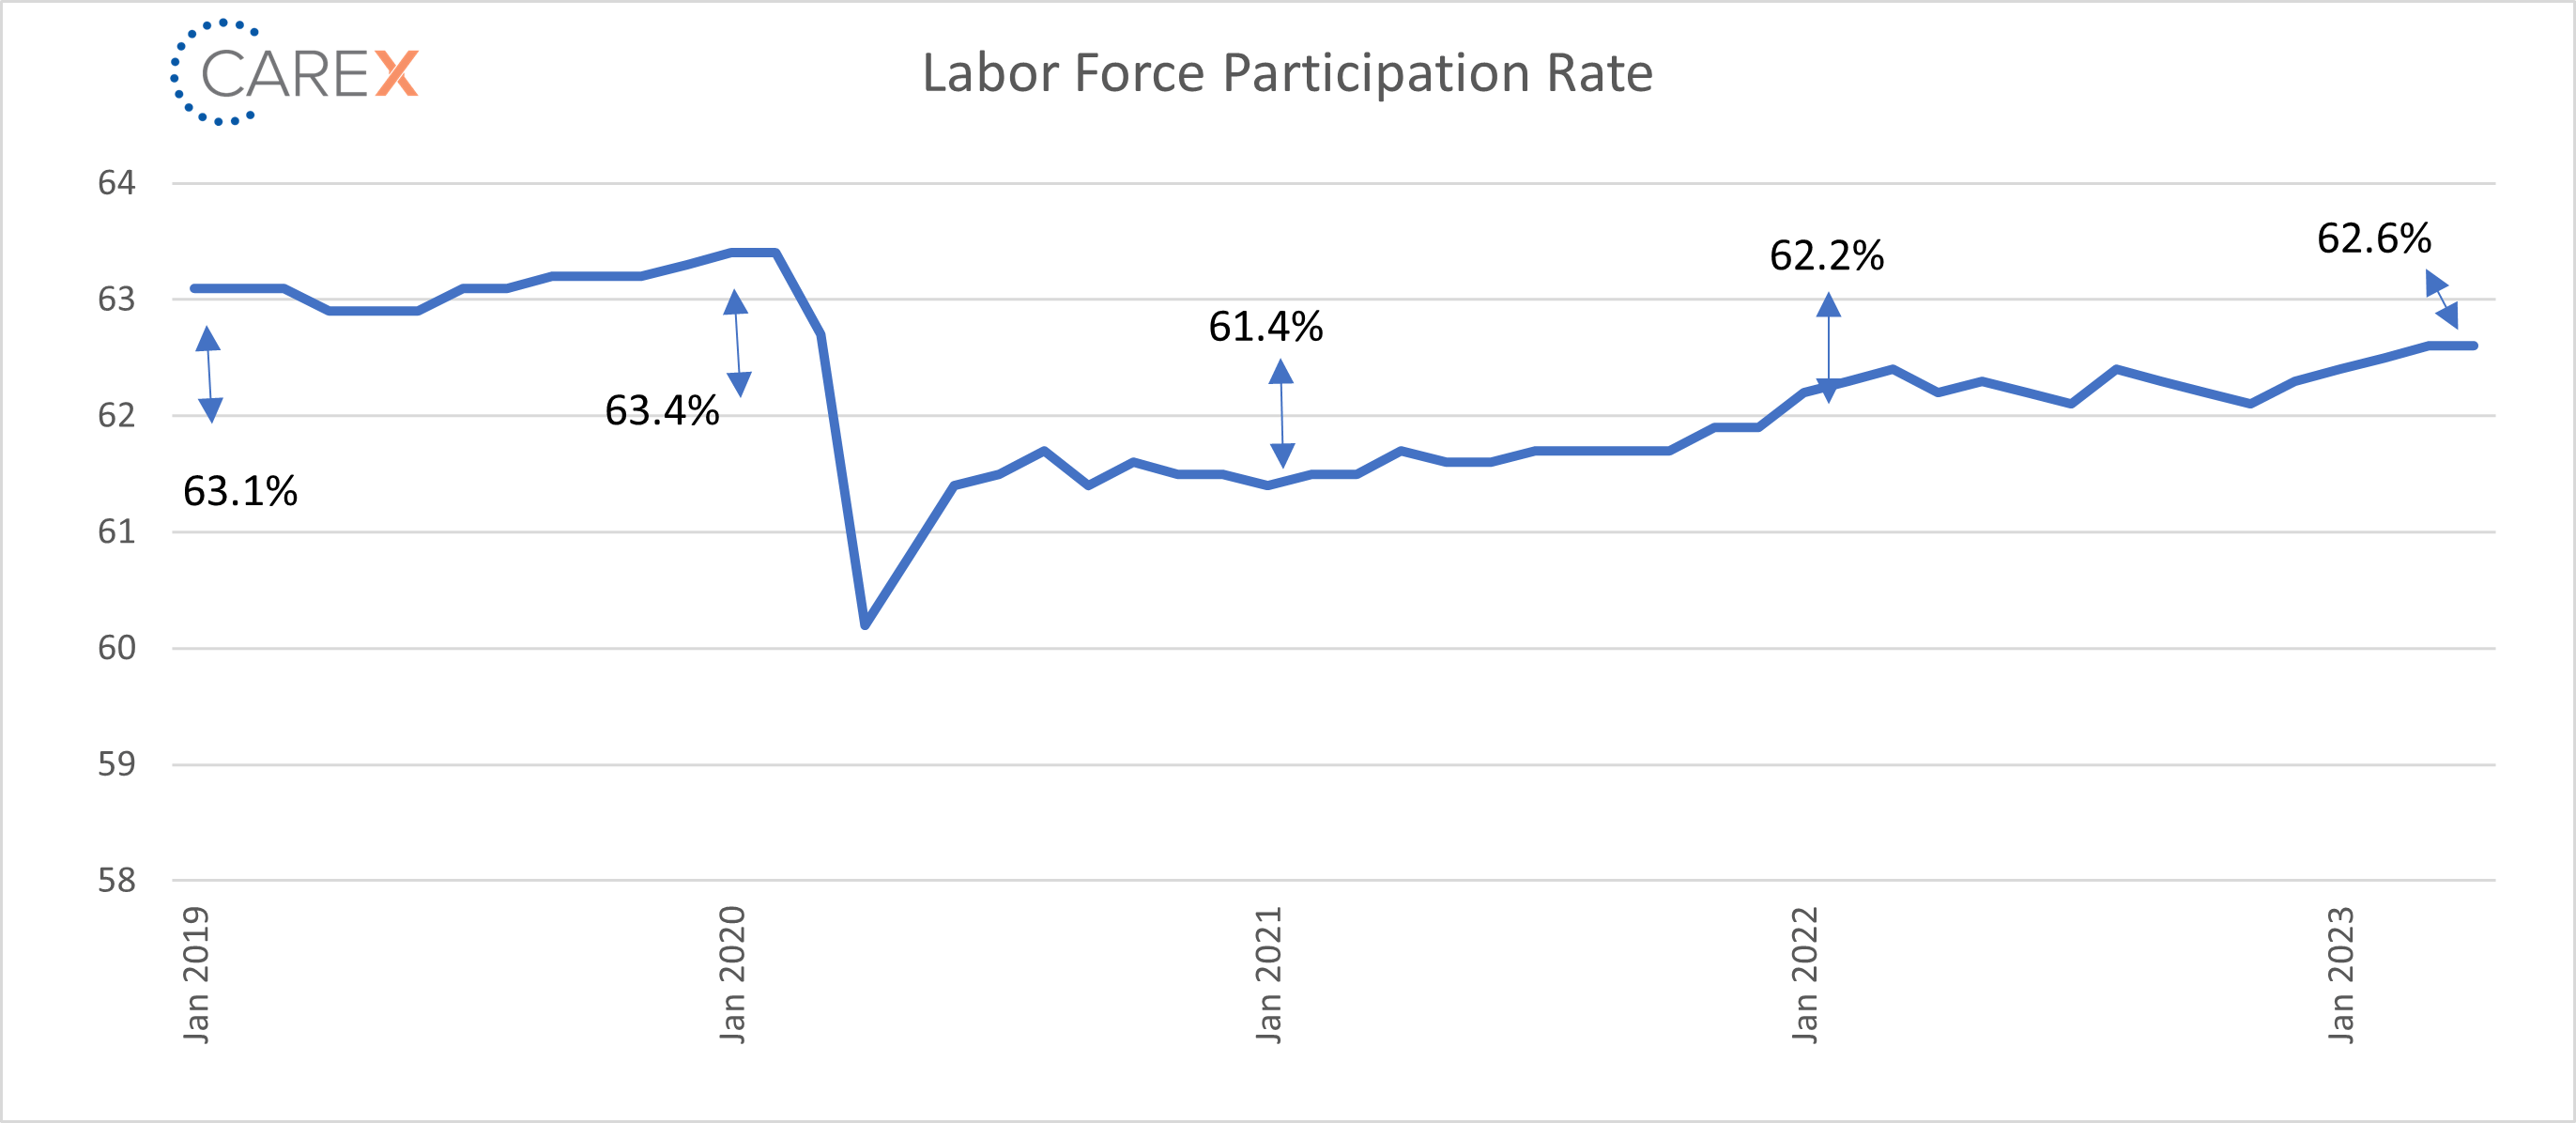
- Labor force participation rate (LFPR) held steady at 62.6%.
- The highest since the pandemic started in early 2020 but still leaves it well below the pre-COVID level of 63.4%.
- The prime-age LFPR rate hit 83.3% in April, the highest level since 2008.
To make sure you never miss a Labor Market Insights update, you can subscribe to receive these updates via email here! And while you’re here, make sure to check out the other resources we have available.