
New job reports were just released! Here’s our labor market insights for November 2023.
Key Takeaways:
Rice cakes, the World Series, who’s dating Taylor Swift, and the ridiculous advice being doled out on LinkedIn by self-proclaimed experts/influencers. Similar to this month’s jobs report—they’re all boring, and most people don’t really care.
I love sports. So much so, that if my children hear the words “the bears,” their immediate response is “still suck” (much to my wife’s chagrin). In sporting terms, this month’s data is like a tie in soccer (lame!). The Fed is feeling good because of a soft(er) jobs report, an increase in unemployment, and slow wage growth (average hourly earnings rose 0.2% in October and were up 4.1% over the past 12 months). Also notable, the labor force shrunk by 201k (the number of unemployed people rose by 146,000 in October, while the number of people with jobs fell by 348,000). Meanwhile, Team “Labor Market” is happy we’re trending toward a soft landing, and the employment landscape remains—largely—healthy despite the Fed’s recent pressure.
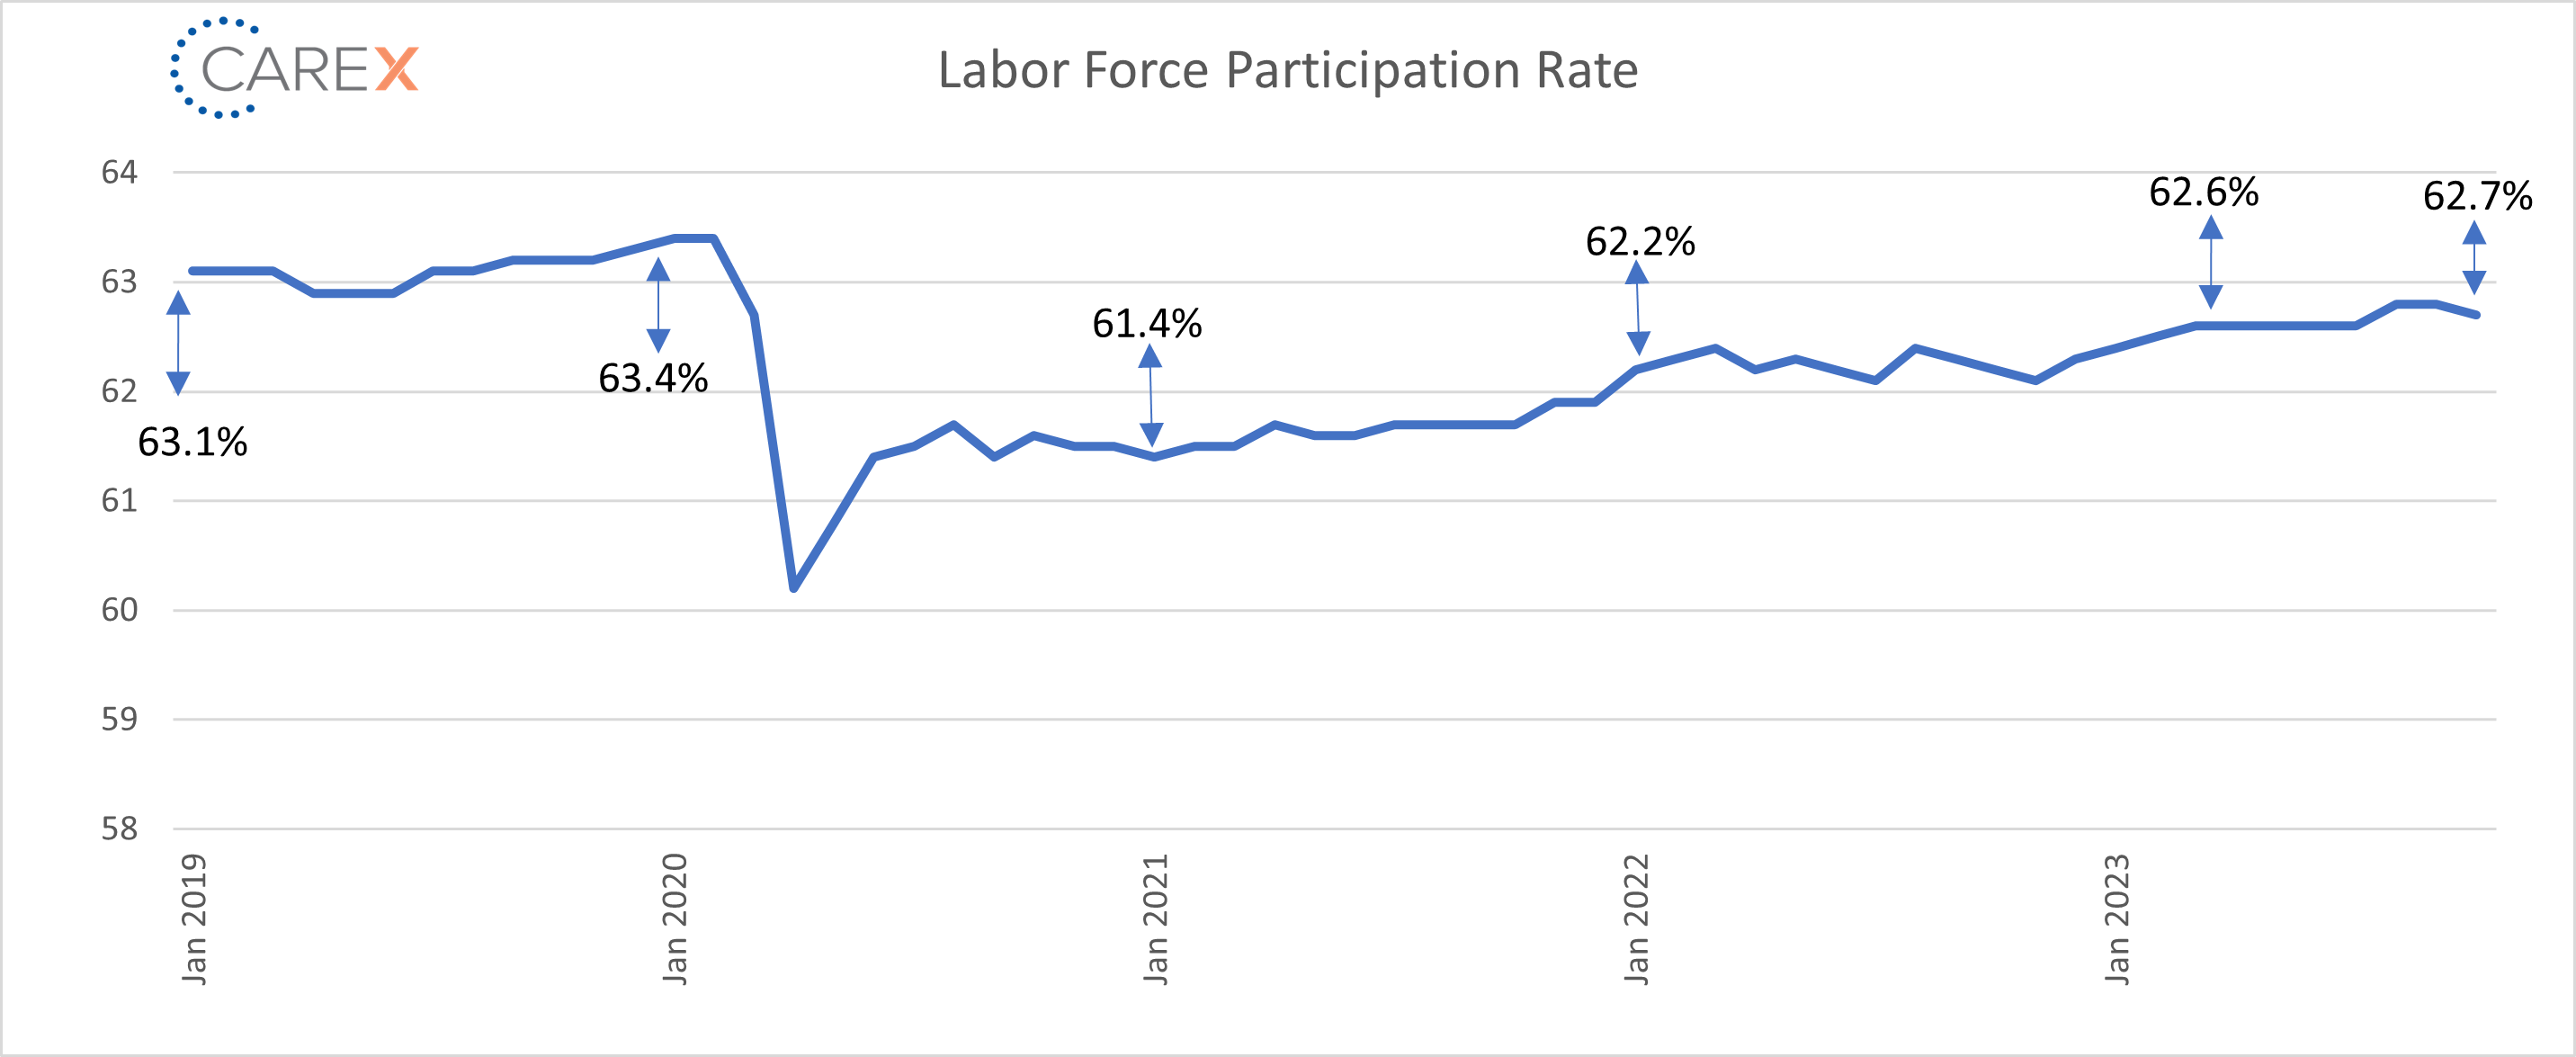
While it’s hard to get excited about a tie, I’m left feeling like a win is around the corner. Not because of this month’s data, but because of the small trends we started to see several months ago. The prime age Labor Force Participation Report (LFPR)—a metric closely watched by policymakers as a sign of labor market health—is still considered strong (only 1.1 percentage points away from the all-time record attained in April 2000). Economists forecast that we need to add ~125k new jobs each month to keep up with population growth. If you look at the below graph, you’ll see that we’re averaging well above that mark. Lastly, total separations have leveled off, and we’re still hovering around 10 million open jobs per month. I’m encouraged by the tailwinds, and while I anticipate further cooling in Q4, I’m cautiously optimistic about 2024.
In the spirit of sports—I’m offering two UW Badger men’s basketball tickets (to any game, apart from the Badger vs. Marquette game) to the first two people who email me (mattd@carexconsultinggroup.com) at the release of this report. No strings attached; I’ll send two tickets to any game of your choosing to the first two people who email me (even Michigan fans are eligible ).
By the Numbers:
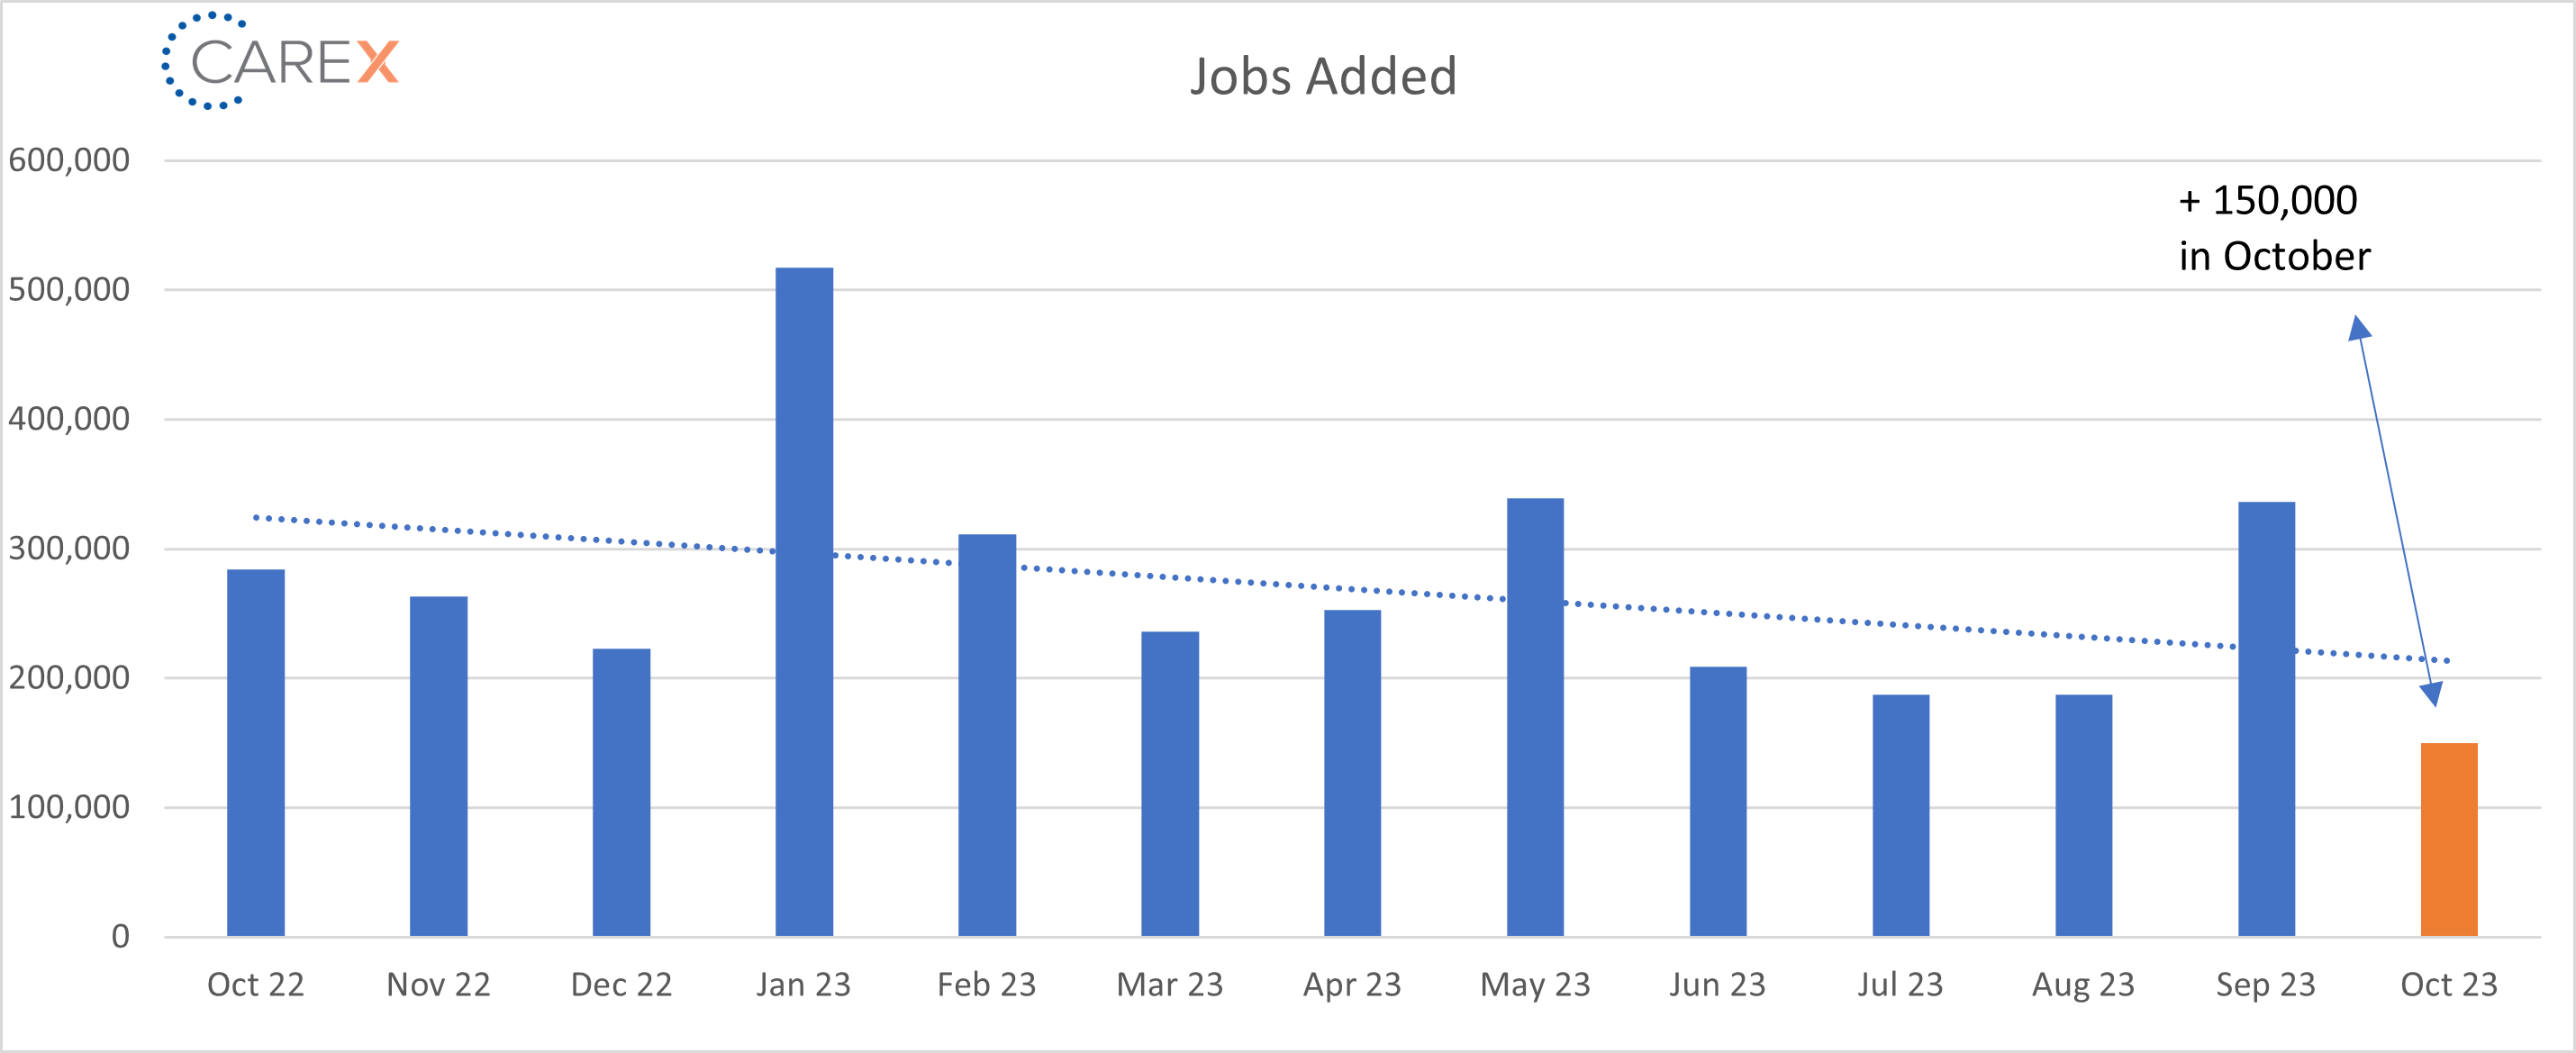
- New Jobs – The U.S. added 150,000 new jobs in October, a significant drop from last month when we added 336,000 jobs (chart above).
- Less than the 170k new jobs predicted by economists.
- The 3-month average is 204k.
- Healthcare led the gains with 58,000 new jobs. Other leading gainers included government (51,000), construction (23,000), and social assistance & Leisure/Hospitality (19,000 each).
- Full-time roles are now leading the way; full-time jobs grew by 326,000, while part-time dropped by 670,000 (likely due to seasonal jobs ending).
- Unemployment rose to 3.9%, a slight increase from 3.8% last month.
- Still low, but the upward trend is notable (and if it continues will be concerning, as it’s a recession indicator).
- The highest level since January 2022.
- Interestingly, this reflects a massive decline in male employment (-416,000) vs. an increase in female employment (+69,000).
- There are ~100,000 people reported being out of work due to a strike or labor dispute in October (the most since 1997).
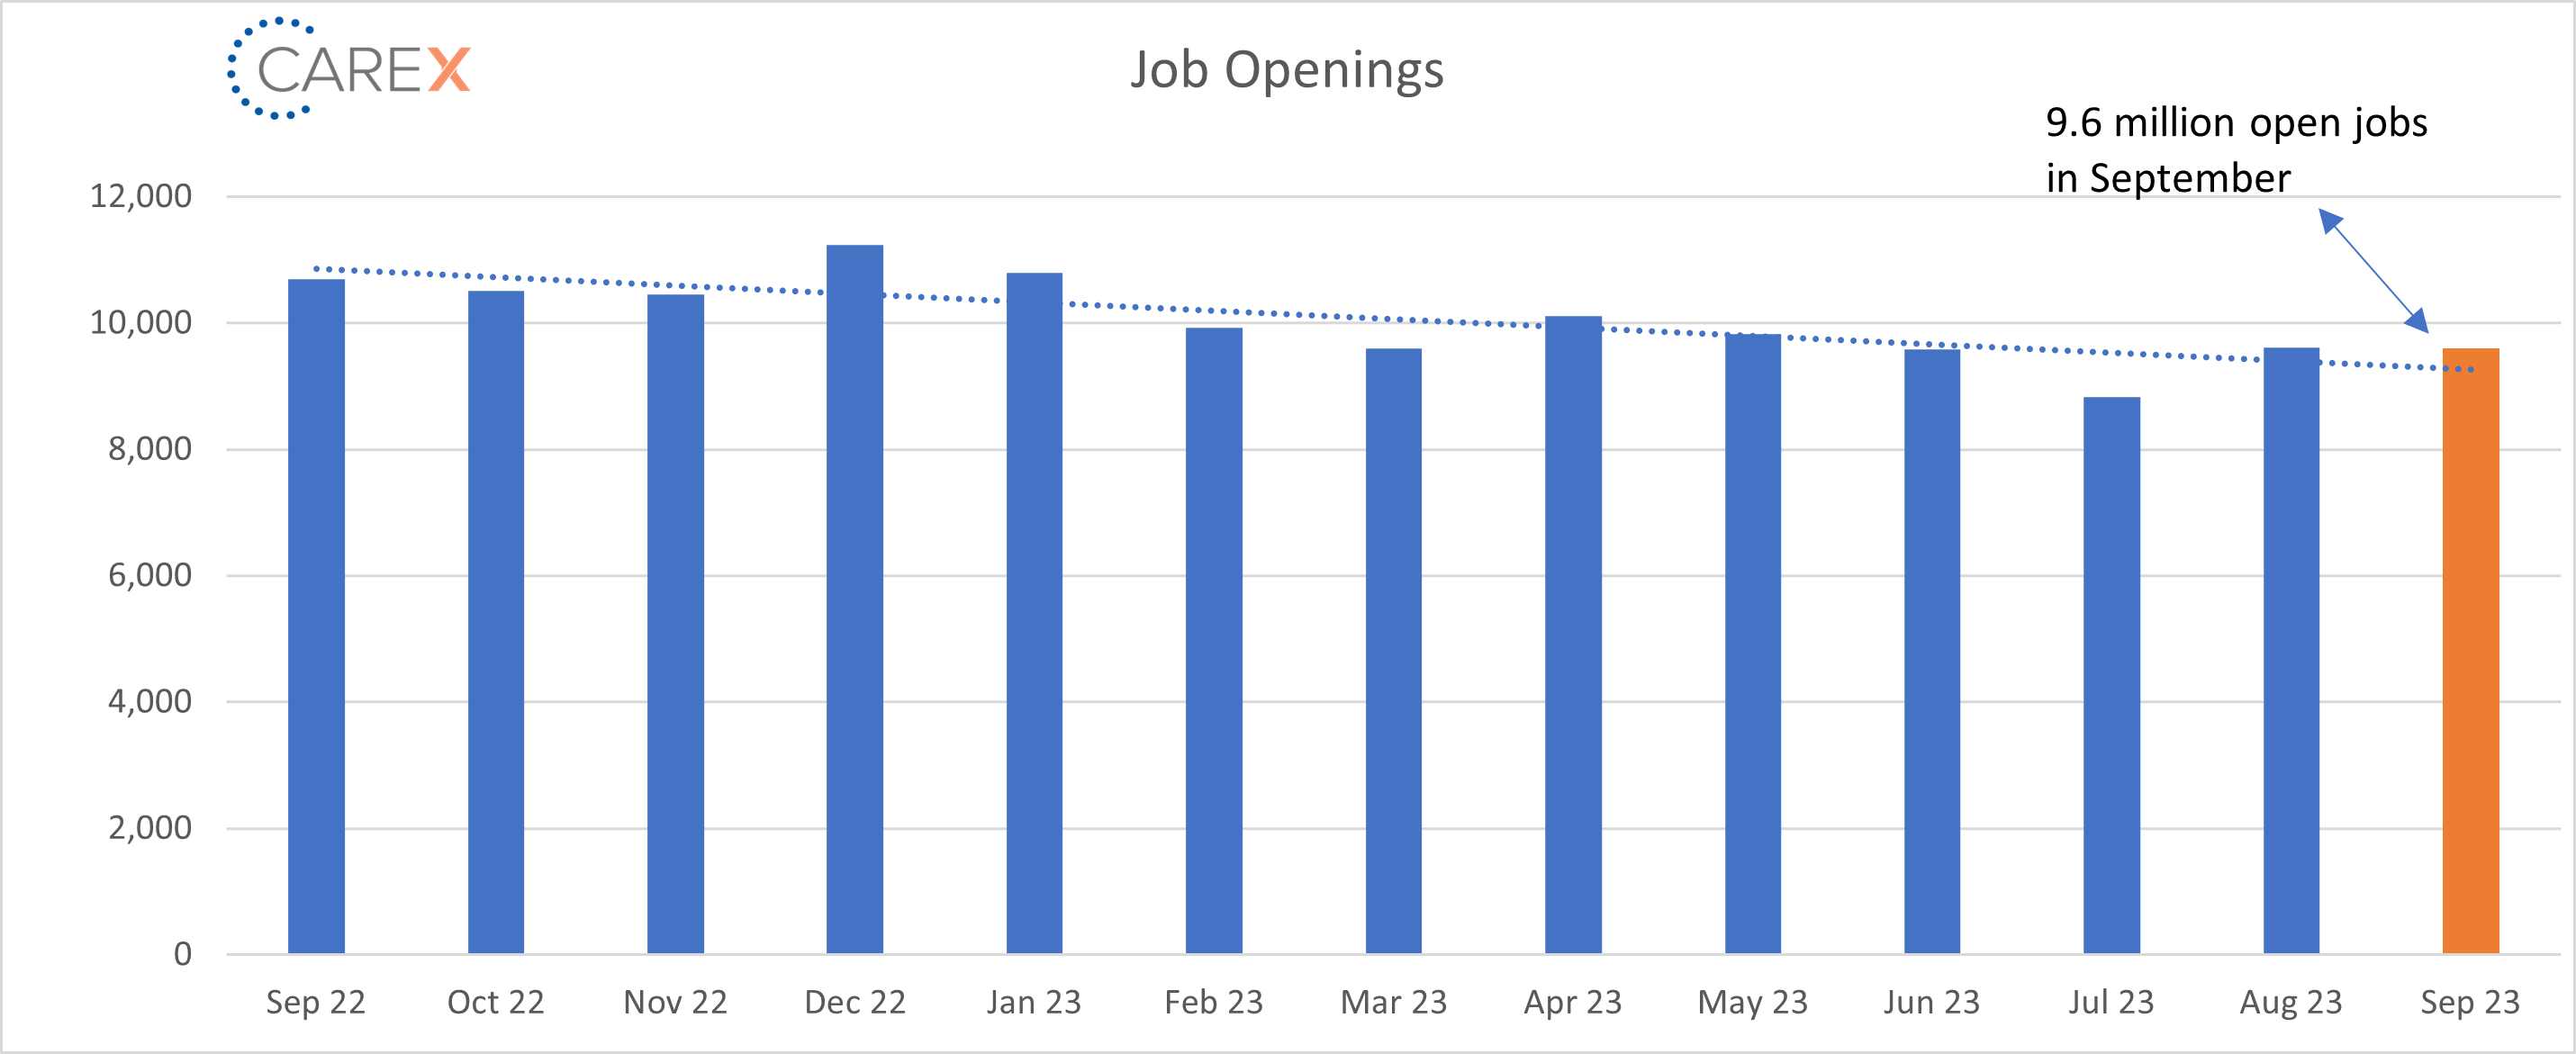
- Job openings remain largely unchanged at 9.6 million.
- Perhaps signifying employers are more apt to retain their current employees vs. hiring new ones.
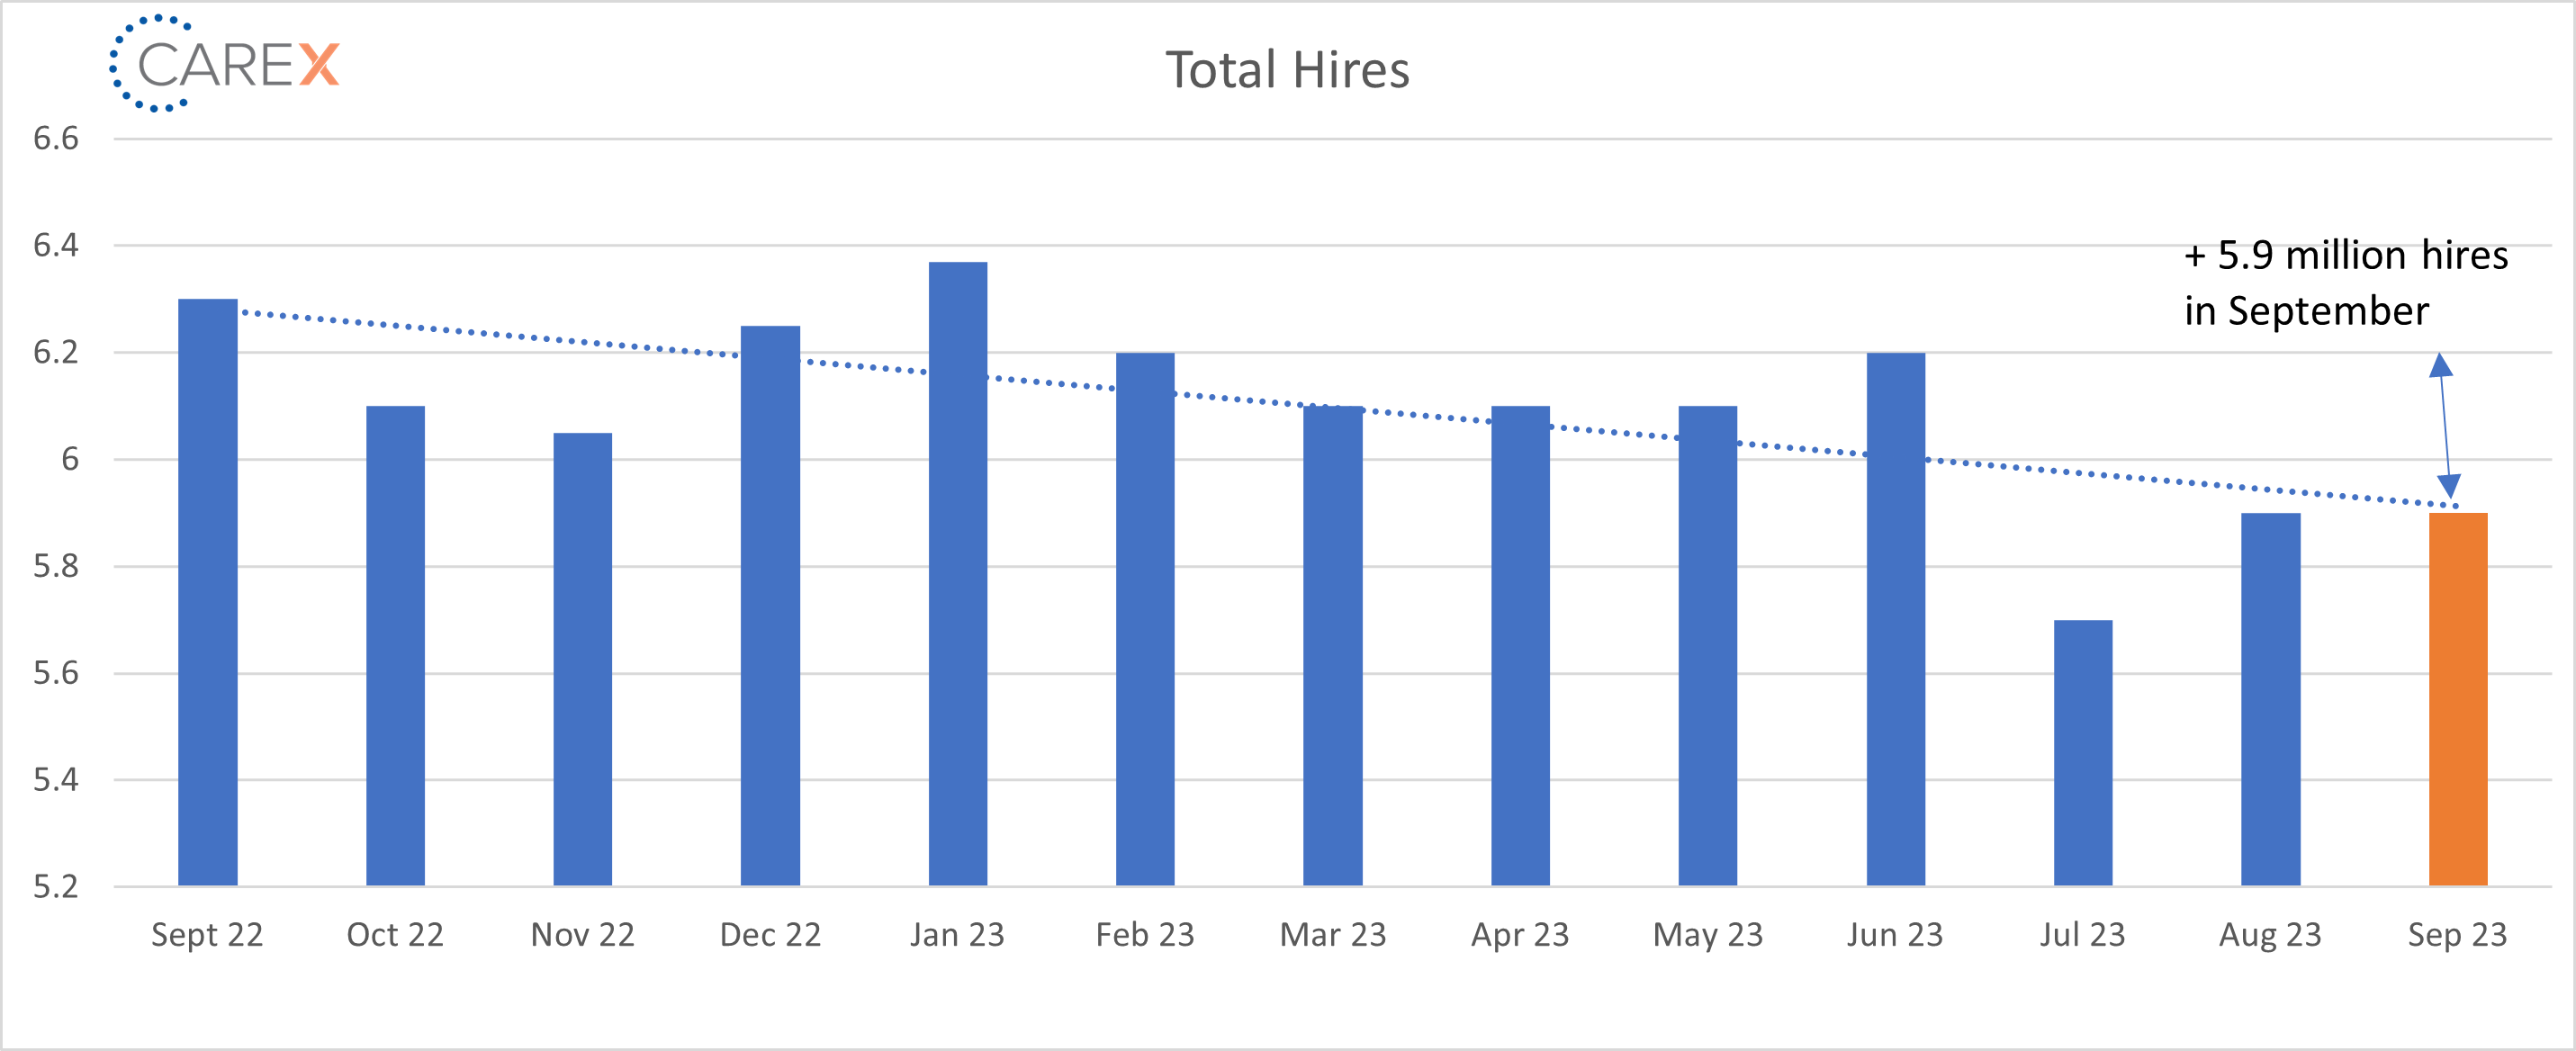
- Hires remained steady at 5.9 million (chart above).
- Layoffs dropped to 1.5 million, a slight decrease from 1.7 million the previous month.
- The number of layoffs remain very low by historical standards.
- Quits – The number of people quitting their job increased slightly to 3.7 million, up from 3.6 million the previous month.
- The quit level hasn’t been this low since early 2021.
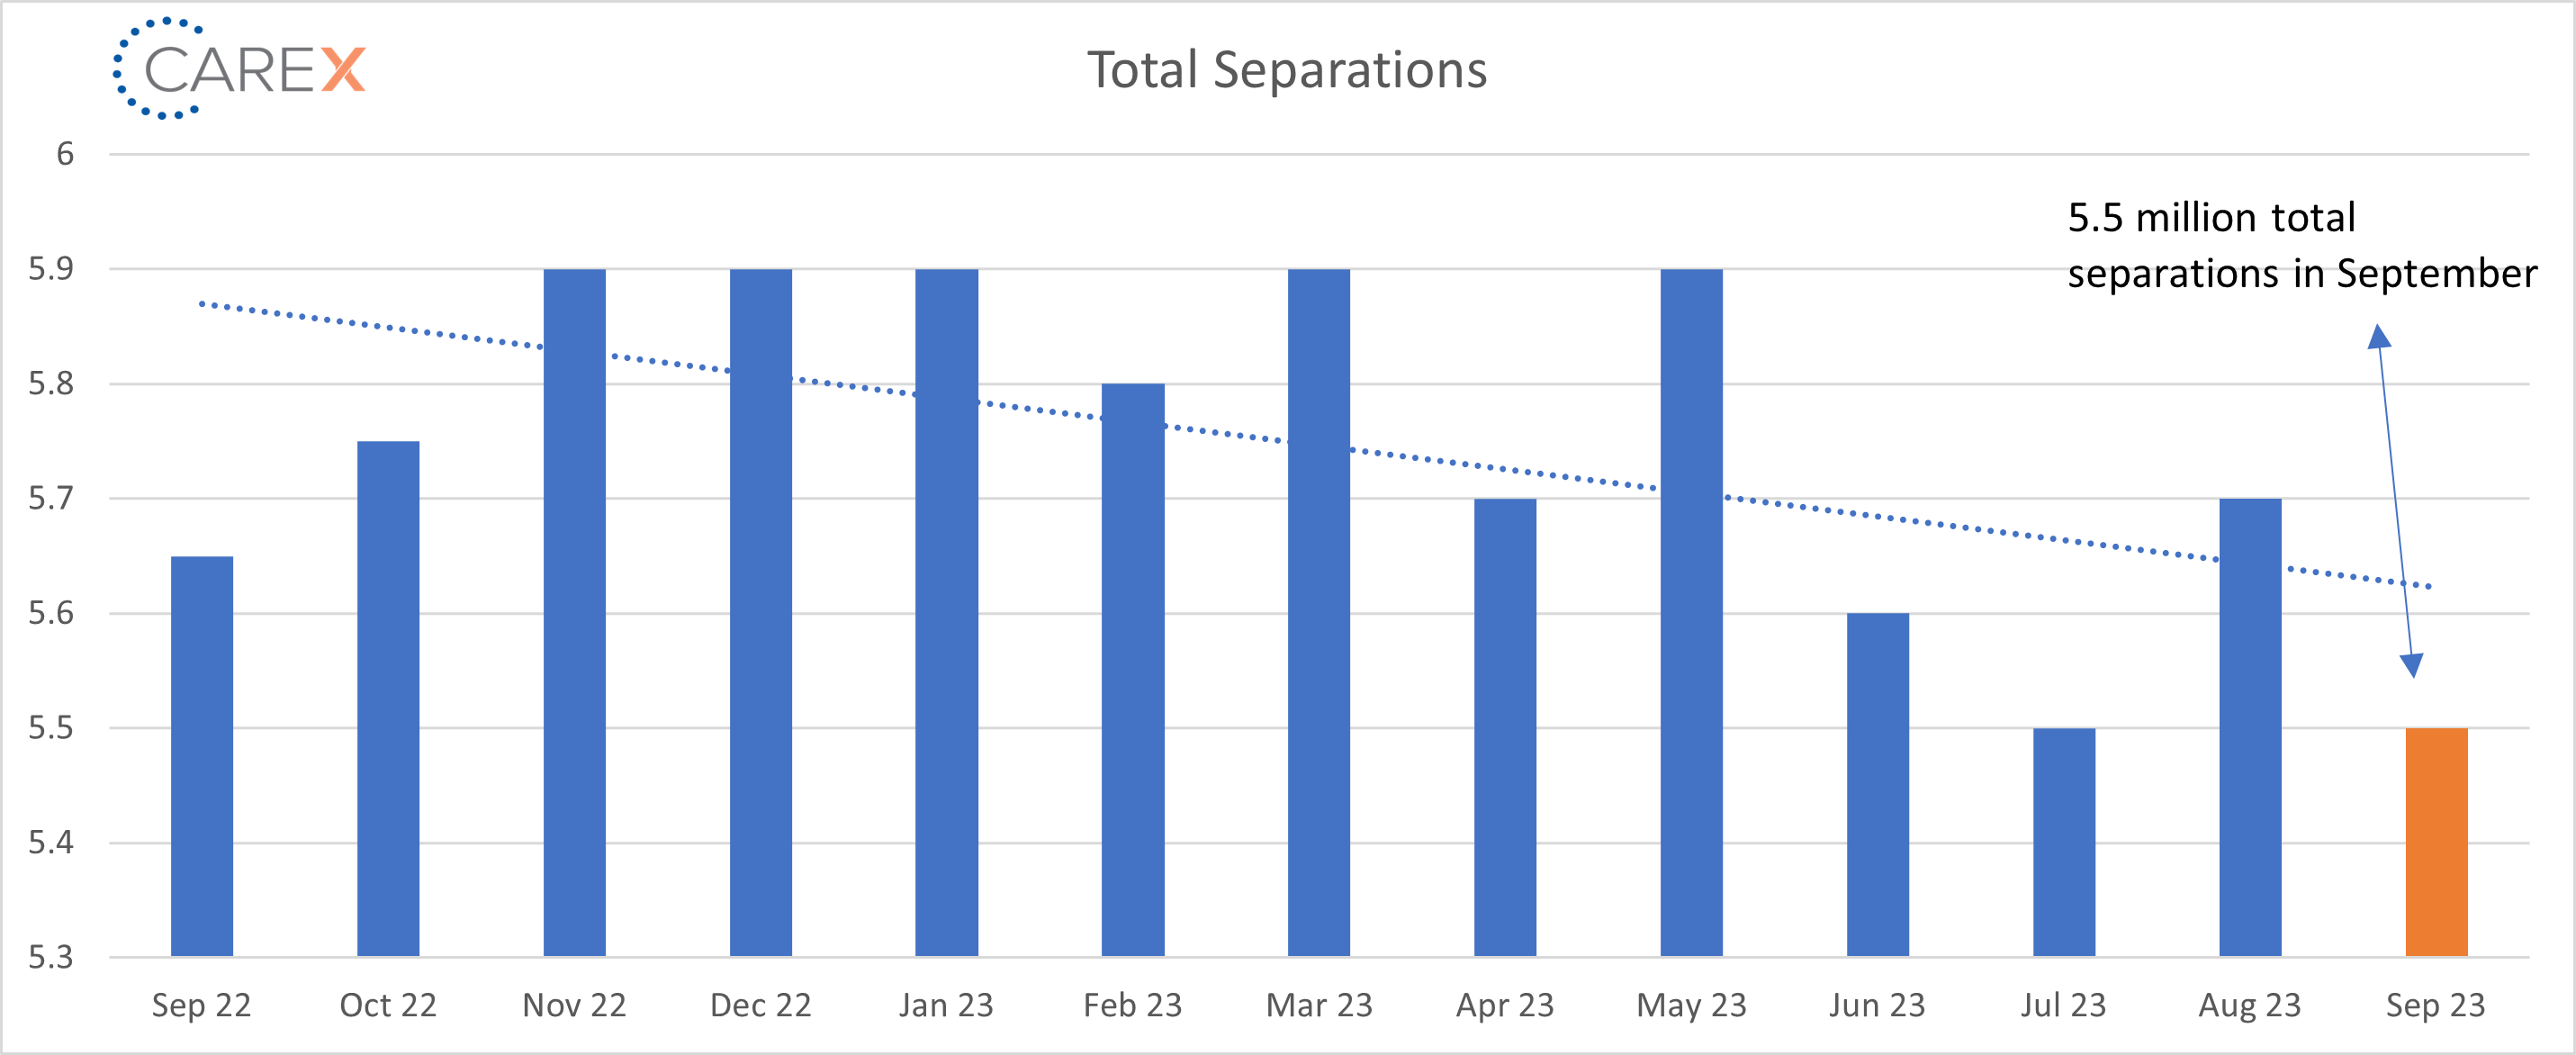
- Total separations decreased slightly to 5.5 million, down from 5.7 million the previous month.
- Jobs per available worker increased to 1.6:1, up from 1.5:1 the previous month, but down from 1.8:1 five months ago.
- Six months ago, the ratio was 1.9:1 (and averaged ~2:1 over the past 2 years).
- The Labor Force Participation Rate (LFPR) fell to 62.7%, a drop from 62.8%.
- The share of prime working age Americans with a job is only 1.1 percentage points away from the all-time record attained in April 2000.
To make sure you never miss a Labor Market Insights update, you can subscribe to receive reminders via email here! While you’re here, make sure to check out the other resources we have available.