
The BLS job reports for last month were just released! We’ll share our take on the labor market for October 2022 and what it means for you and your company.
Relevant Data Points:
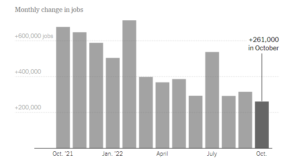
- New Jobs – The U.S. added 261,000 jobs, better than the projected growth of 205,000 (graph below)
- Even with the reduced pace, job growth has been well ahead of its pre-pandemic level (in 2019, monthly payroll growth averaged 164,000).
- The economy added an average of 183,000 jobs per month over the course of the decade before COVID.
- Unemployment rose to 3.7% (up from 3.5%).
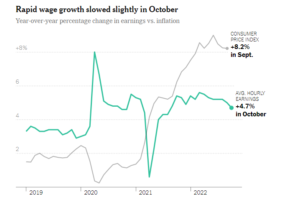
- Wages rose 0.4%, exceeding the prior month’s gain of 0.3% (up 4.7% from one year ago) (graph below).
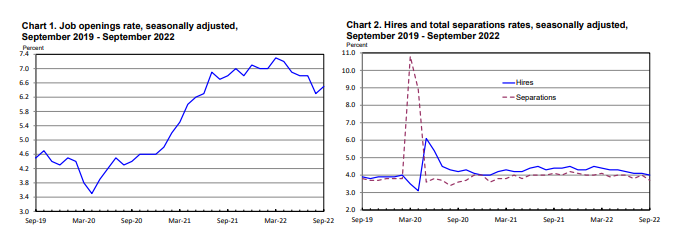
- Job openings totaled 10.72 million (up from 10.05 million), which is well above the estimate of 9.85 million (graph below).
- Hires dropped to just under 6.1 million (from 6.3 million), the lowest level since February 2021.
- Layoffs decreased to 1.3 million (down from 1.5 million).
- Quits dropped to 4.1 million (from 4.16 million).
- Total separations rapidly declined, falling by nearly 400,000 to a rate of 3.7%.
- Jobs per available worker increased to 1.9:1 (increase from 1.67:1).
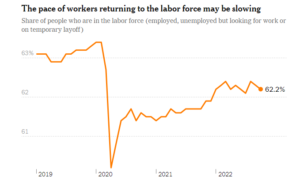
- LFPR (labor force participation rate) continues to edge lower, dropping to 62.2% (from 62.3%); this is more than a percentage point lower than its pre-pandemic high.


 What does this mean?
- This month’s report is a sign of how strong the U.S. job market remains despite the Fed’s attempts to weaken it.
- Although the jobs report was more than expected, it marked the slowest pace of job growth since December 2020.
- Even with another relatively strong labor/jobs report, key indicators show the labor/job market is cooling.
- Declining hires + increase in unemployment + decrease in quits = a cooling labor market.
- Wage growth continues to lag the Consumer Price Index.
- Layoffs continue to grab headlines, but the overall layoff rate is still quite low.
To make sure you never miss a Labor Market Insights update, you can subscribe to receive reminders via email here! While you’re here, make sure to check out the other resources we have available.